NASA Earth Scientist Elected to National Academy of Sciences
3 min read
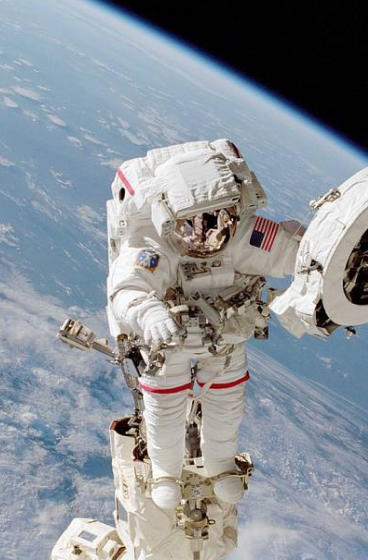
Preparations for Next Moonwalk Simulations Underway (and Underwater)
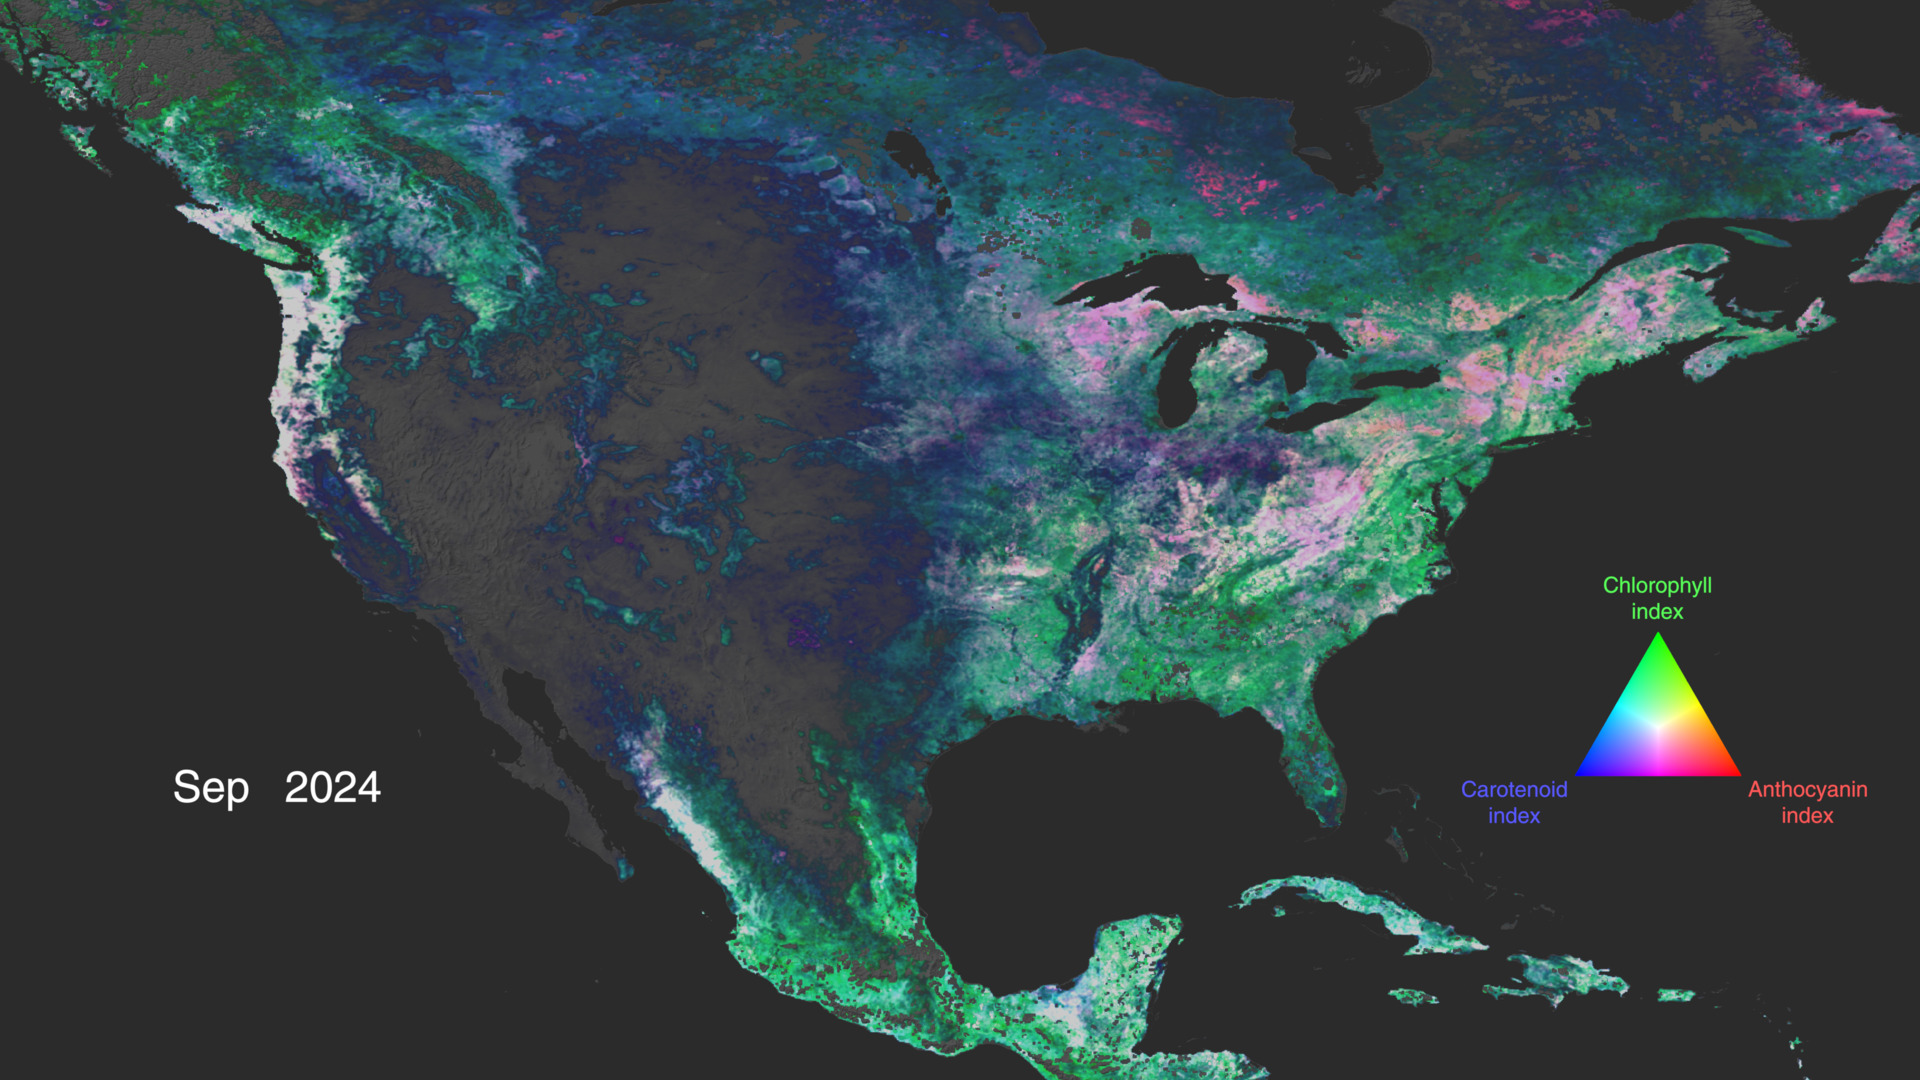
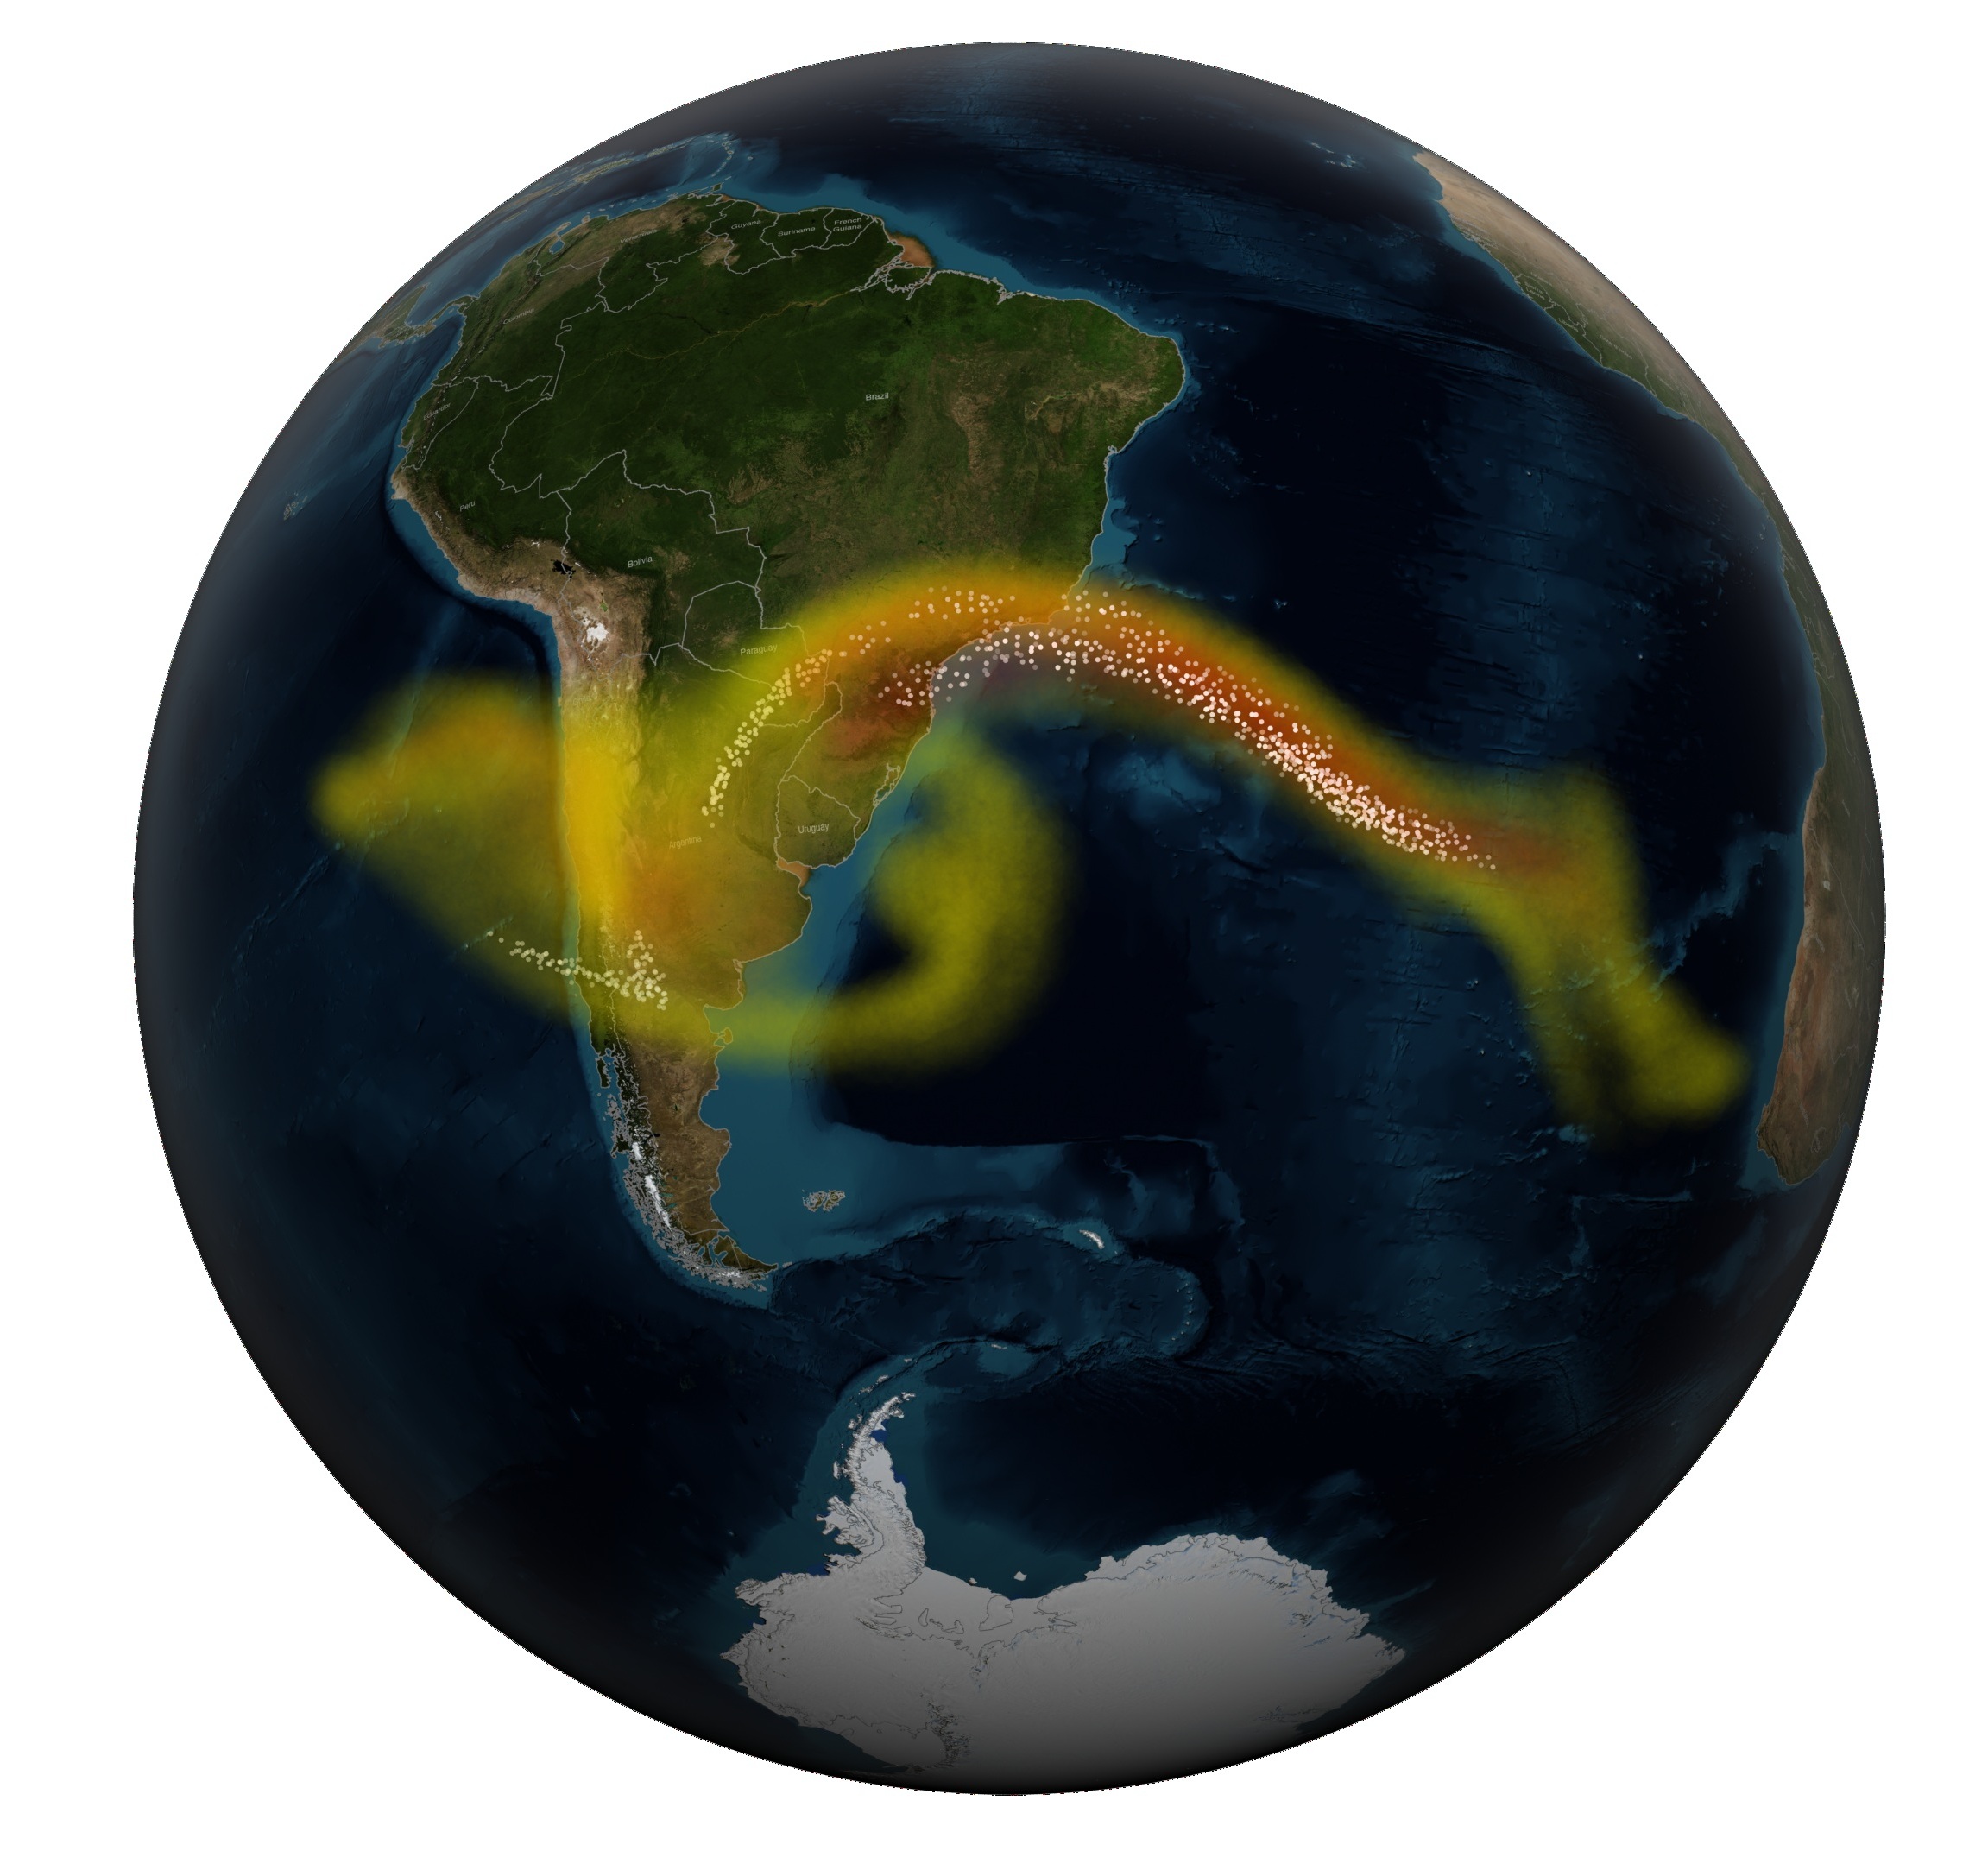
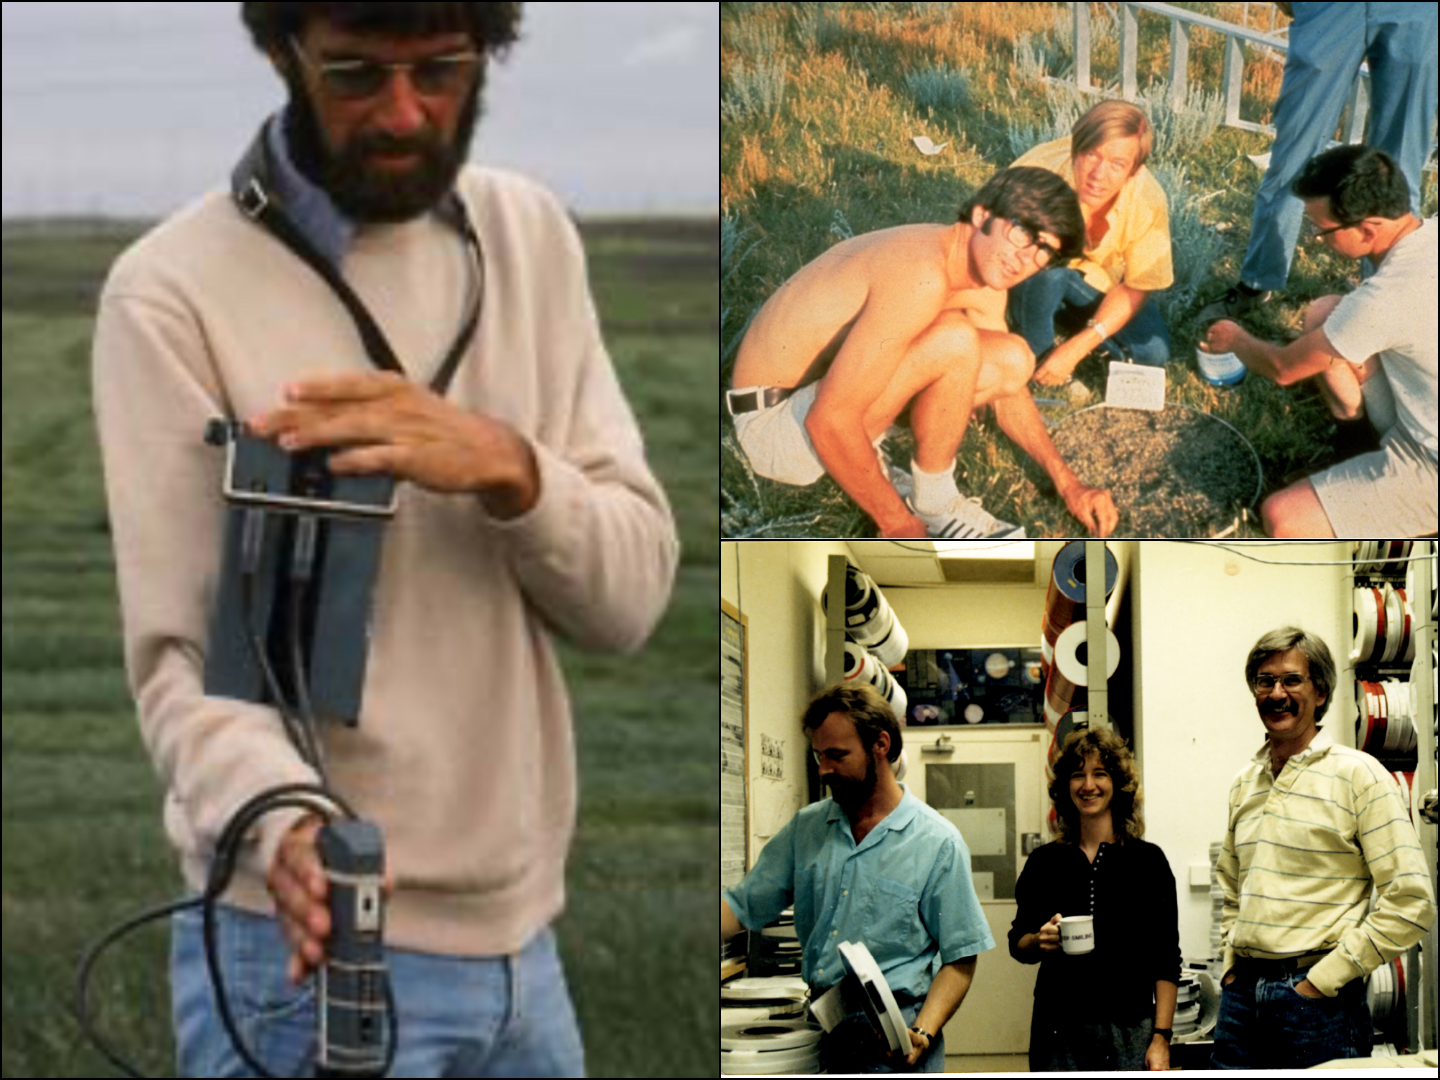
Earth scientist Compton J. Tucker has been elected to the National Academy of Sciences for his work creating innovative tools to track the planet’s changing vegetation from space. It’s research that has spanned nearly 50 years at NASA’s Goddard Space Flight Center in Greenbelt, Maryland, where he is a visiting scientist after retiring in March.
Tucker’s research began with identifying wavelengths of light that are absorbed or reflected as plants undergo photosynthesis, and has evolved into calculating the health and productivity of vegetation over time with satellites.
“I’m honored and surprised,” Tucker said of his election. “There were opportunities at the Goddard Space Flight Center that have enabled this work that couldn’t be found elsewhere. There were people who built satellites, who understood satellite data, and had the computer code to process it. All the work I’ve done has been part of a team, with other people contributing in different ways. Working at NASA is a team effort of science and discovery that’s fun and intellectually rewarding.”

Tucker earned his master’s and doctoral degrees from Colorado State University, where he worked on a National Science Foundation-funded project analyzing spectrometer data of grassland ecosystems. In 1975, he came to NASA Goddard as a postdoctoral fellow and used what he learned in his graduate work to modify the imager on National Oceanic and Atmospheric Administration (NOAA) meteorological satellites and modify Landsat’s thematic mapper instrument.
He became a civil servant at the agency in 1977, and continued work with radiometers to study vegetation – first with handheld devices, then with NOAA’s Advanced Very High Resolution Radiometer satellite instruments. He has also used data from Landsat satellites, Moderate Resolution Imaging Spectroradiometer instruments, and commercial satellites. His scientific papers have been cited 100,000 times, and one of his recent studies mapped 10 billion individual trees across Africa’s drylands to inventory carbon storage at the tree level.
“The impact of Compton Tucker’s work over the last half-century at Goddard is incredible,” said Dalia Kirschbaum, director of the Earth Sciences Division at NASA Goddard. “Among his many achievements, he essentially developed the technique of using satellites to study photosynthesis from plants, which people have used to monitor droughts, forecast crop shortages, defeat the desert locust, and even predict disease outbreaks. This is a well-deserved honor.”
The National Academy of Sciences was proposed by Abraham Lincoln and established by Congress in 1863, charged with advising the United States on science and technology. Each year, up to 120 new members are elected “in recognition of their distinguished and continuing achievements in original research,” according to the organization.
In addition his role as a visiting scientist at Goddard, Tucker is also an adjunct professor at the University of Maryland and a consulting scholar at the University of Pennsylvania’s University Museum. He was awarded the National Air and Space Collins Trophy for Current Achievement in 1993 and the Vega Medal by the Swedish Society of Anthropology and Geography in 2014. He is a fellow of the American Association for the Advancement of Science and the American Geophysical Union, and won the Senior Executive Service Presidential Rank Award for Meritorious Service in 2017, among other honors.
NASA’s Goddard Space Flight Center, Greenbelt, Md.