Preparations for Next Moonwalk Simulations Underway (and Underwater)
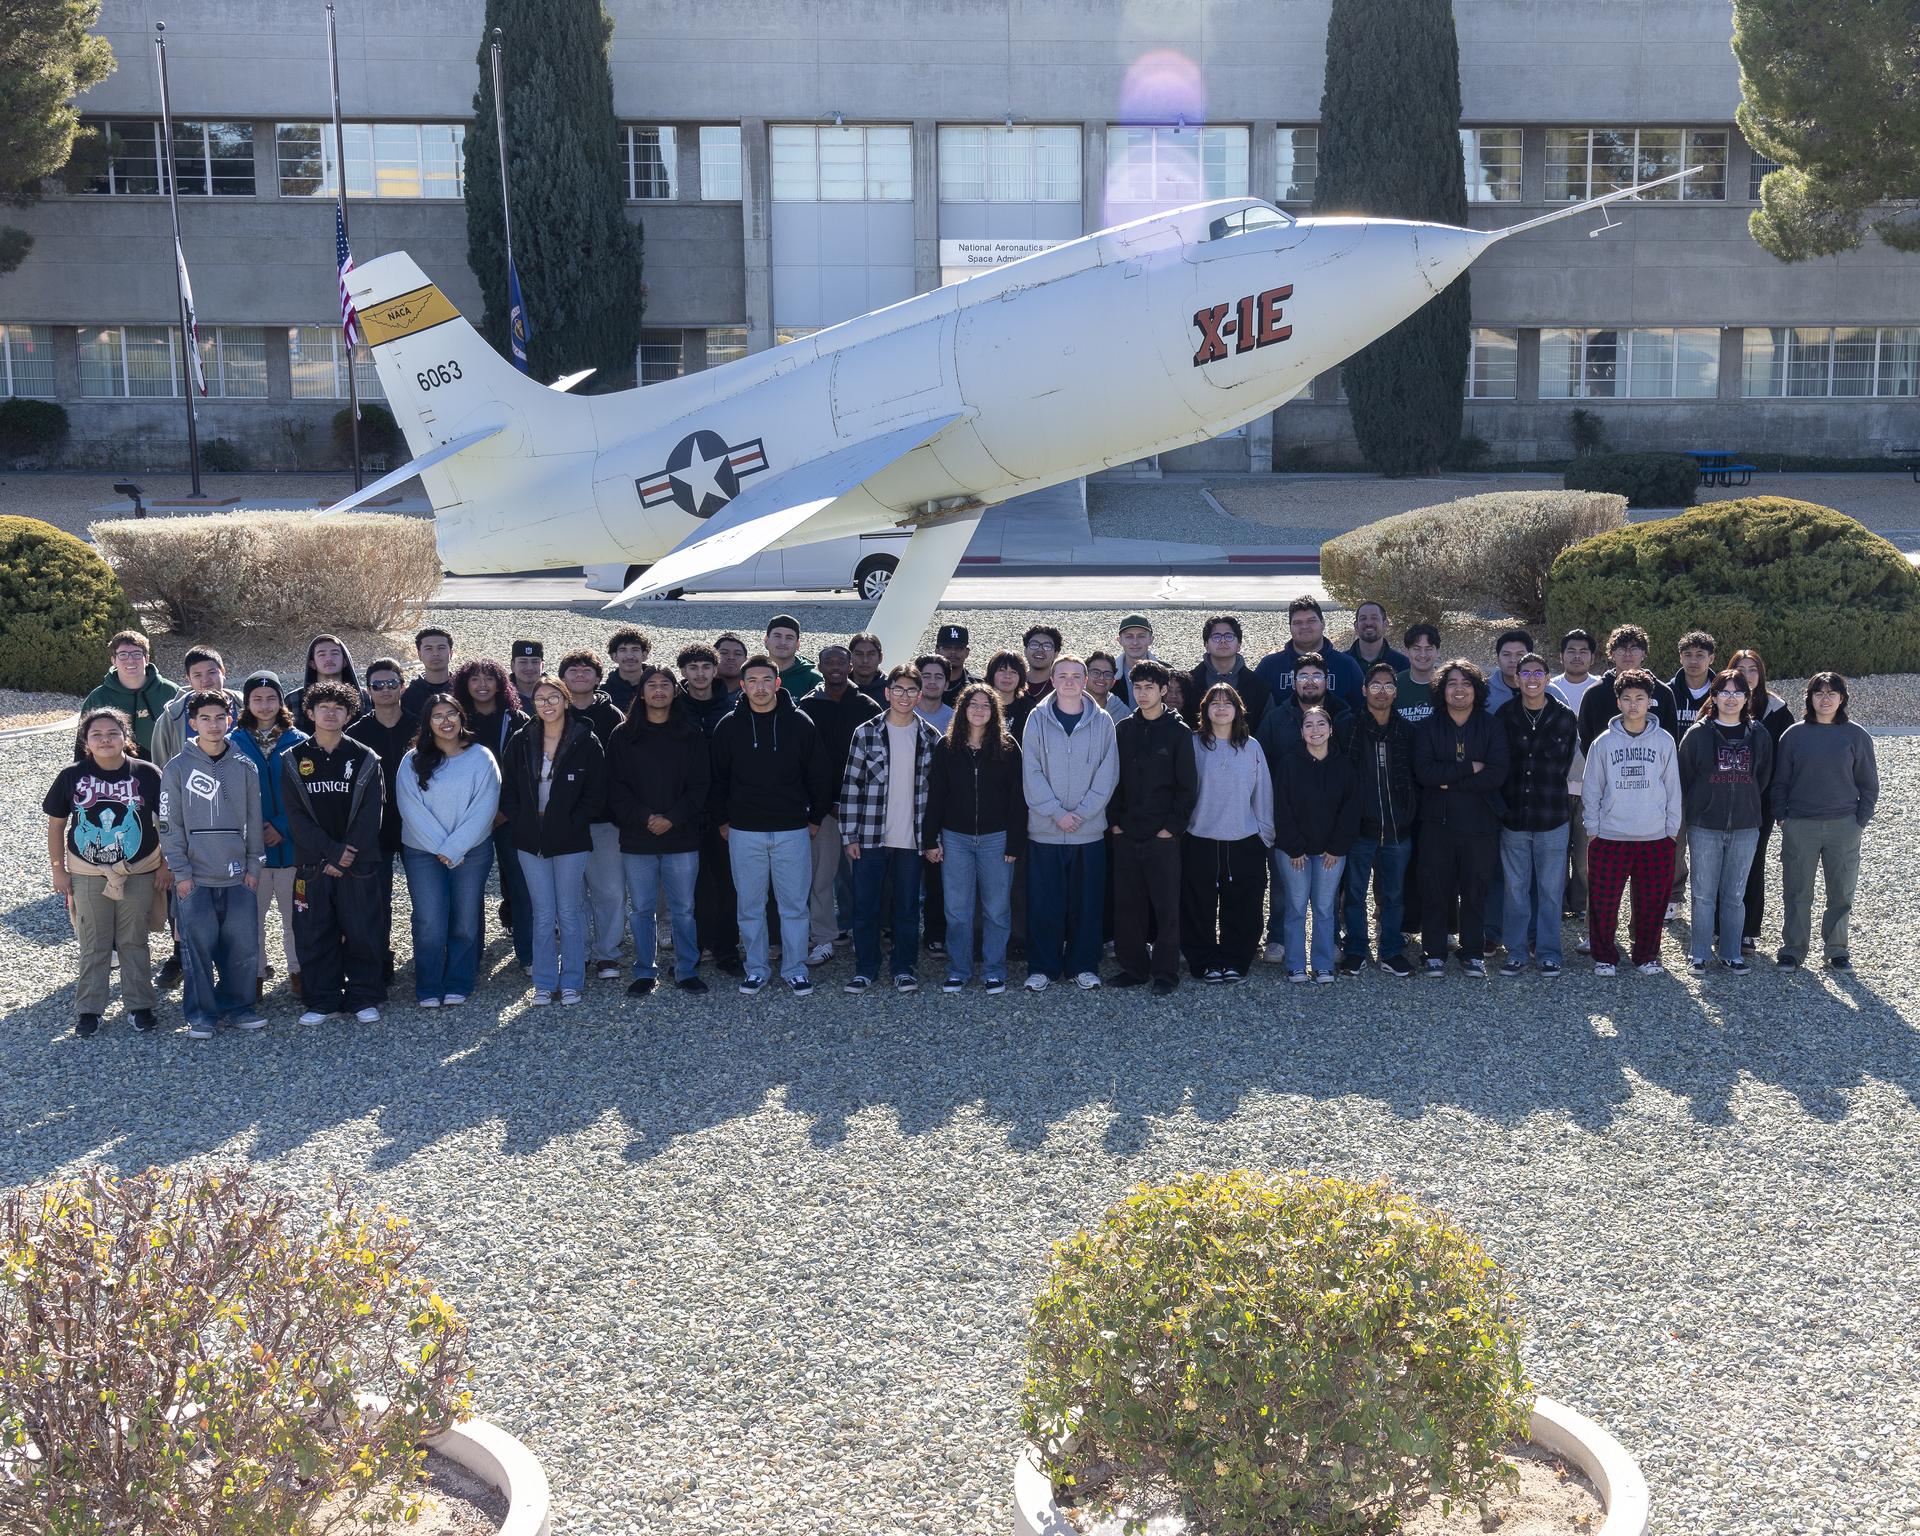
The engineering club from Palmdale High School in Palmdale, California, visits NASA’s Armstrong Research Flight Center in Edwards, California. The students took a group photo in front of the historic X-1E aircraft on display at the center.
NASA/Genaro Vavuris
A group of enthusiastic high school students recently visited NASA to learn about facilities and capabilities that enable the agency’s researchers to explore, innovate, and inspire for the benefit of humanity.
Engineering club students from Palmdale High School in California were able to connect classroom lessons to real-world applications, sparking curiosity and ambition while at NASA’s Armstrong Flight Research Center in Edwards, California. “I learned a lot about the different careers that you can get at a place like NASA,” student Roberto Cisnero said.
Through partnerships with the regional STEM community, NASA’s STEM Engagement provides local students with hands-on opportunities aligned with NASA’s missions. “Many students do not get the opportunity to be encouraged to pursue STEM careers. Part of our NASA mission is to be that encourager,” said Randy Thompson, deputy director for NASA Armstrong Research and Engineering.
Highlights from the visit included demonstrations at a mission control room, the Subscale Flight Research Laboratory, the Flight Loads Laboratory, and the Experimental Fabrication Shop, all of which support high-risk, atmospheric flight research and test projects. Students engaged with laboratory technicians, engineers, and program managers, asking questions about the work they do. “It was fun to see what the valued people at NASA do with all of the resources,” student Jonathan Peitz said.
NASA’s California Office of STEM Engagement hosted the visit in celebration of National Aviation History Month. By supporting students, educators, and expanding STEM participation, NASA aims to inspire future leaders and build a diverse, skilled workforce.
Students examine the Global Hawk Fairing Load Test at the Experimental Fabrication Shop at NASA’s Armstrong Research Flight Center in Edwards, California. The students are from the engineering club from Palmdale High School in Palmdale, California.
NASA/Steve Freeman
Students tour a control room at NASA’s Armstrong Research Flight Center in Edwards, California. The students are from the engineering club at Palmdale High School in Palmdale, California.
NASA/Steve Freeman
Students look at a subscale model at the Dale Reed Subscale Flight Research Laboratory at NASA’s Armstrong Research Flight Center in Edwards, California. The students are from the engineering club from Palmdale High School in Palmdale, California.
NASA/Steve Freeman
Students examine small parts made at the Experimental Fabrication Shop at NASA’s Armstrong Research Flight Center in Edwards, California. The students are from the engineering club from Palmdale High School in Palmdale, California.
NASA’s Small Spacecraft Systems Virtual Institute (S3VI) is pleased to announce the official release of the highly anticipated 2024 State-of-the-Art Small Spacecraft Technology report. This significant accomplishment was made possible by the contributions of numerous dedicated people across NASA who graciously supported the preparation of the document as authors and reviewers. We also want to extend our gratitude to all the companies, universities, and organizations that provided content for this report.
The 2024 report can be found online at https://www.nasa.gov/smallsat-institute/sst-soa. The report is also available in PDF format as a single document containing all report content as well as individual chapters available on their respective chapter webpages. This 2024 edition reflects updates in several chapters to include: the Formation Flying and Rendezvous and Proximity Operations section within the “Guidance, Navigation, and Control” chapter; the Additive Manufacturing section within the “Structures, Materials, and Mechanisms” chapter; the Free Space Optical Communications section within the “Communications” chapter; and the Hosted Orbital Services section within the “Complete Spacecraft Platforms” chapter.
As in previous editions, the report contains a general overview of current state-of-the-art SmallSat technologies and their development status as discussed in open literature. The report is not intended to be an exhaustive representation of all technologies currently available to the small spacecraft community, nor does the inclusion of technologies in the report serve as an endorsement by NASA. Sources of publicly available date commonly used as sources in the development of the report include manufacturer datasheets, press releases, conference papers, journal papers, public filings with government agencies, and news articles. Readers are highly encouraged to reach out to companies for further information regarding the performance and maturity of described technologies of interest. During the report’s development, companies were encouraged to release test information and flight data when possible so it may be appropriately captured. It should be noted that technology maturity designations may vary with change to payload, mission requirements, reliability considerations, and the associated test/flight environment in which performance was demonstrated.
Suggestions or corrections to the 2024 report toward a subsequent edition, should be submitted to the NASA Small Spacecraft Systems Virtual Institute Agency-SmallSat-Institute@mail.nasa.gov for consideration prior to the publication of the future edition. When submitting suggestions or corrections, please cite appropriate publicly accessible references. Private correspondence is not considered an adequate reference. Efforts are underway for the 2025 report and organizations are invited to submit technologies for consideration for inclusion by August 1, 2025.
NASA’s Small Spacecraft Technology program within the Space Technology Mission Directorate funds the Small Spacecraft Systems Virtual Institute.
Summary of the 10th DSCOVR EPIC and NISTAR Science Team Meeting
Introduction
The 10thDeep Space Climate Observatory (DSCOVR) Earth Polychromatic Camera (EPIC) and National Institute of Standards and Technology (NIST) Advanced Radiometer [NISTAR] Science Team Meeting (STM) was held October 16–18, 2024. Over 50 scientists attended, most of whom were from NASA’s Goddard Space Flight Center (GSFC), with several participating from other NASA centers, U.S. universities, and U.S. Department of Energy laboratories. There was one international participant – from Estonia. A full overview of DSCOVR’s Earth-observing instruments was published in a previous article in TheEarth Observer and will not be repeated here. This article provides the highlights of the 2024 meeting. The meeting agenda and full presentations can be downloaded from GSFC’s Aura Validation Data Center.
Opening Presentations
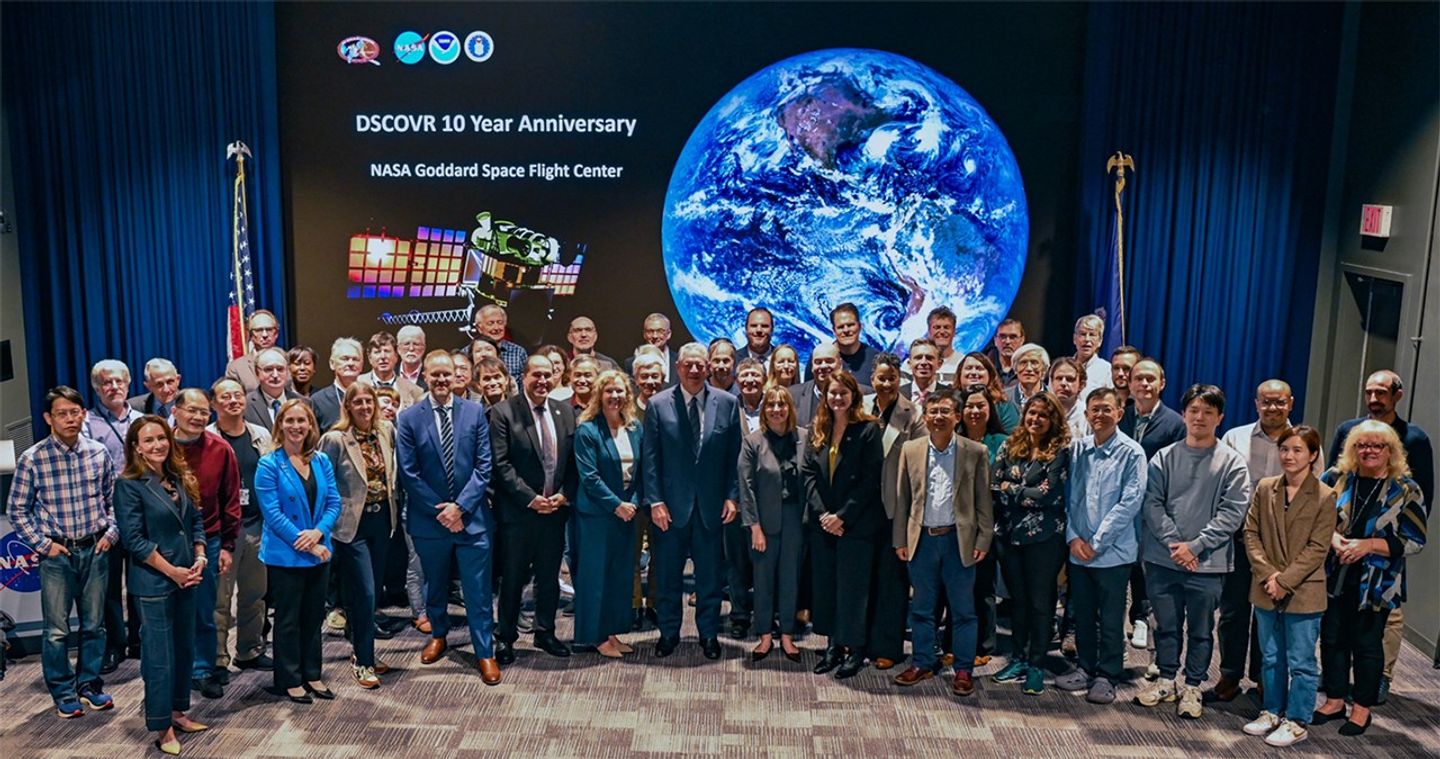
The opening session of the 10th DSCOVR STM was special. FormerU.S., Vice President Al Gore attended the opening session and gave a presentation at the panel discussion “Remote Sensing and the Future of Earth Observations” – see Photo. Gore was involved in the early days of planning the DSCOVR mission, which at that time was known as Triana. He reminisced about his involvement and praised the team for the work they’ve done over the past decade to launch and maintain the DSCOVR mission. Following the STM Opening Session, Gore spoke at a GSFC Engage session in Building 3 later that afternoon on the same topic, but before a wider audience. [Link forthcoming.]
Following Gore’s remarks, the remainder of the opening session consisted of a series of presentations from DSCOVR mission leaders and representatives from GSFC and National Oceanic and Atmospheric Administration (NOAA). Thomas Neumann [GSFC, Earth Sciences Division (ESD)—Deputy Director] opened the meeting and welcomed Vice President Gore and the STM participants on behalf of the ESD. Adam Szabo [GSFC—DSCOVR Project Scientist] briefly reported that the spacecraft was still in “good health.” The EPIC and NISTAR instruments on DSCOVR continue to return their full science observations. He also gave an update on DSCOVR Space Weather research. Alexander Marshak [GSFC—DSCOVR Deputy Project Scientist] briefly described DSCOVR mission history and the science results based on DSCOVR observations from the first Sun–Earth Lagrange point (hereinafter, the L1 point). He also summarized the major EPIC and NISTAR results to date. At this time, more than 125 papers related to DSCOVR are listed on the EPIC website. Elsayed Talaat [NOAA, Office of Space Weather observations—Director] discussed the future of Earth and space science studies from the L1 point.
Photo.Former U.S. Vice President Al Gore spoke at the opening session of the 10th DSCOVR Science Team Meeting. This photo shows Gore together with Makenzie Lystrup [NASA’s Goddard Space Flight Center (GSFC)—Center Director], Christa Peters-Lidard [GSFC, Director of the Science and Exploration Directorate], Elsayed Talaat [National Oceanic and Atmospheric Administration (NOAA)—Director of the Office of Space Weather Observations], Dalia Kirschbaum [GSFC—Director of Earth Sciences], other GSFC management, and members of the DSCOVR Science Team.
Photo credit: Katy Comber (GSFC)
Updates on DSCOVR Operations
The DSCOVR mission components continue to function nominally. The meeting was an opportunity to update participants on progress over the past year on several fronts, including data acquisition, processing, and archiving, and release of new versions of several data products. The number of people using DSCOVR data continues to increase, with a new Science Outreach Team having been put in place to aid users in several aspects of data discovery, access, and user friendliness.
Amanda Raab [NOAA, DSCOVR Mission Operations and Systems] reported on the current status of the DSCOVR mission. She also discussed spacecraft risks and issues such as memory fragmentation and data storage task anomalies but indicated that both these issues have been resolved.
Hazem Mahmoud [NASA’s Langley Research Center (LaRC)] discussed the work of the Atmospheric Science Data Center(ASDC), which is based at LaRC. He showed DSCOVR mission metrics since 2015, focusing on data downloads and the global outreach of the mission. He noted that there has been a significant rise in the number of downloads and an increasing diversity of countries accessing ozone (O3), aerosol, and cloud data products. Mahmoud also announced that the ASDC is transitioning to the Amazon Web Services cloud, which will further enhance global access and streamline DSCOVR data processing.
Karin Blank [GSFC] covered the discovery of a new type of mirage that can only be seen in deep space from EPIC. The discussion included the use of a ray tracer in determining the origin of the phenomenon, and under what conditions it can be seen.
Alexander Cede [SciGlob] and Ragi Rajagopalan [LiftBlick OG] gave an overview of the stability of the EPIC Level-1A (L1A) data over the first decade of operation. They explained that the only observable changes in the EPIC calibration are to the dark count and flat field can – and that these changes can be entirely attributed to the temperature change of the system in orbit compared to prelaunch conditions. No additional hot or warm pixels have emerged since launch and no significant sensitivity drifts have been observed. The results that Cede and Rajagopalan showed that EPIC continues to be a remarkably stable instrument, which is attributed to a large extent to its orbit around the L1 point, which is located outside the Earth’s radiation belts and thus an extremely stable temperature environment. Consequently, in terms of stability, the L1 point is far superior to other Earth observation points, e.g., ground-based, low-Earth orbit (LEO), polar orbit, or geostationary Earth orbit (GEO).
Marshall Sutton [GSFC] discussed the state of the DSCOVR Science Operation Center (DSOC). He also talked about processing EPIC Level-1 (L1) data into L2 science products, daily images available on the EPIC website, and special imaging opportunities, e.g., volcanic eruptions.
EPIC Calibration
After 10 years of operation in space, the EPIC instrument on DSCOVR continues to be a remarkably stable instrument. The three presentations describe different ways that are used to verify the EPIC measurements remain reliable.
ConorHaney [LaRC] reported on anomalous outliers during February and March 2023 from the broadband shortwave (SW) flux using EPIC L1B channel radiances. To ensure that these outliers were not a result of fluctuations in the EPIC L1B channel radiances, both the EPIC radiance measurements and coincident, ray-matched radiance measurements from the Visible Infrared Imaging Radiometer Suite (VIIRS), on the Suomi National Polar-orbiting Partnership (Suomi NPP) platform, were processed using the same deep convective cloud invariant target (DCC-IT) algorithm. This analysis confirmed that the anomalous behavior was due to the DCC-IT algorithm – and not because of fluctuations in the EPIC L1B channel radiances. The improved DCC-IT methodology was also applied to the EPIC L1B radiances. The results indicate that the EPIC record is quite stable with a lower uncertainty than when processed using the previous DCC-IT methodology.
Igor Geogdzhaev [NASA’s Goddard Institute for Space Studies (GISS)/Columbia University] reported that EPIC Visible–Near Infrared (VIS-NIR) calibration based on VIIRS (on Suomi NPP) data has showed excellent stability, while VIIRS (on NOAA-20 and -21) derived gains agree to within 1–2%. Preliminary analysis showed continuity in the gains derived from Advanced Baseline Imager (ABI) data. (ABI flies on NOAA’s two operational Geostationary Operational Environmental Satellite–Series R satellites – GOES-17 and GOES-18.
Liang–Kang Huang [Science Systems and Applications, Inc. (SSAI)] reported on updates to the EPIC ultraviolet (UV) channel sensitivity time dependences using Sun-normalized radiance comparisons between EPIC and measurements from the Ozone Mapping and Profiler Suite (OMPS) Nadir Mapper (NM) on Suomi NPP, with coinciding footprints and solar/satellite angles. Huang’s team determined vignetting factors in the sensitivity calibration between 2021–2024, as a function of charge coupled device (CCD) pixel radius and pixel polar angles, using special lunar measurement sequences.
NISTAR Status and Science with Its Observations
The NISTAR instrument remains fully functional and continues its uninterrupted data record. The NISTAR-related presentations during this meeting included more details on specific topics related to NISTAR as well as on efforts to combine information from both EPIC and NISTAR.
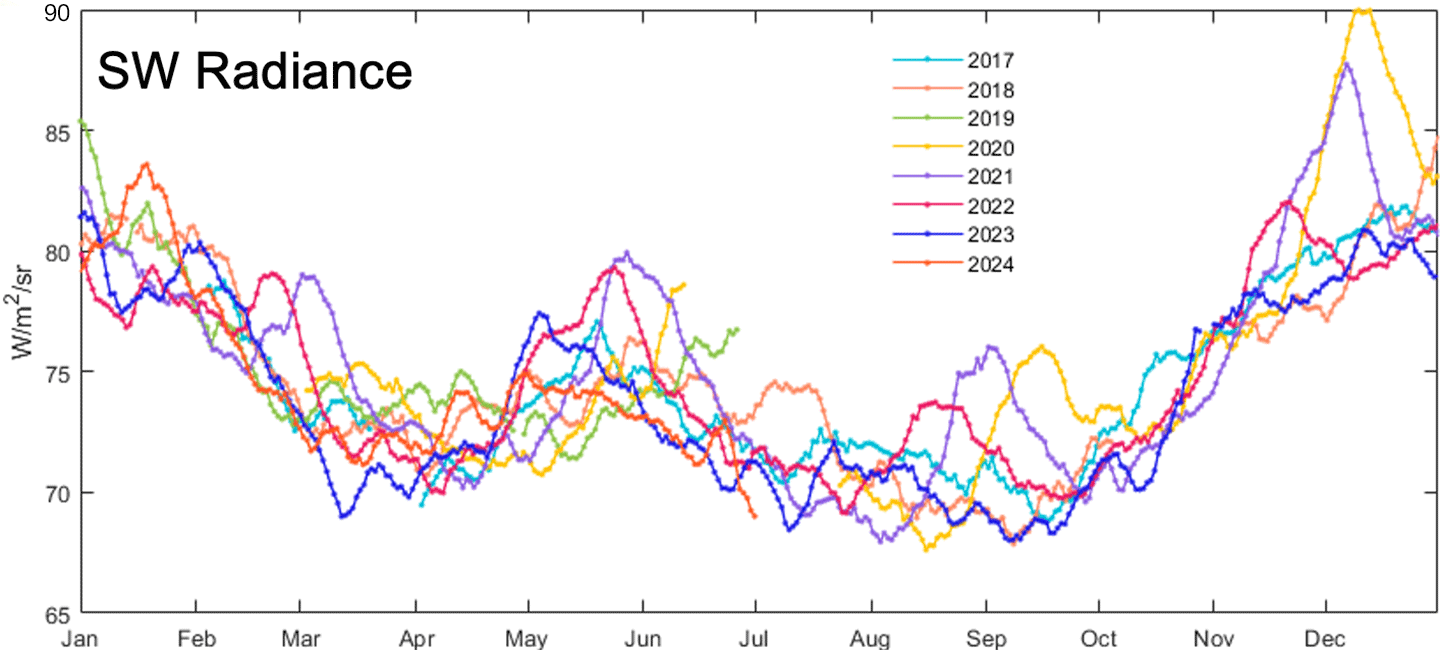
Steven Lorentz [L-1 Standards and Technology, Inc.] reported that the NISTAR on DSCOVR has been measuring the irradiance from the sunlit Earth in three bands for more than nine years. The three bands measure the outgoing total and reflected-solar radiation from Earth at a limited range of solar angles. To compare the long-term stability of EPIC and NISTAR responses, researchers developed a narrowband to wideband conversion model to allow the direct comparison of the EPIC multiband imagery and NISTAR SW – see Figure 1 – and silicon photodiode channels. Lorentz presented daily results spanning several years. The comparison employed different detectors from the same spacecraft – but with the same vantage point – thereby avoiding any model dependent orbital artifacts.
Figure 1. NISTAR daily average shortwave (SW) radiance plotted for each year from 2017–2024. The results indicated a 10% increase in the shortwave radiance as the backscattering angle approaches 178° in December 2020. A 6% increase is noted in September of the same year.
Figure credit: Steven Lorentz (L-1 Standards and Technology)
Clark Weaver [University of Maryland, College Park (UMD)] used spectral information from the SCanning Imaging Absorption spectroMeter for Atmospheric CartograpHY (SCIAMACHY), which flew on the European Space Agency’s (ESA) Envisat satellite from 2002–2012, to fill EPIC spectral gaps. He reported on construction of a composite height resolution spectrum that was spectrally integrated to produce SW energy. Weaver explained that he compared the EPIC reflected SW with four-hour averages from Band 4 on NISTAR. He used spectral information from SCIAMACHY to fill in gaps. Weaver also discussed results of a comparison of area integrated EPIC SW energy with observations from NISTAR .
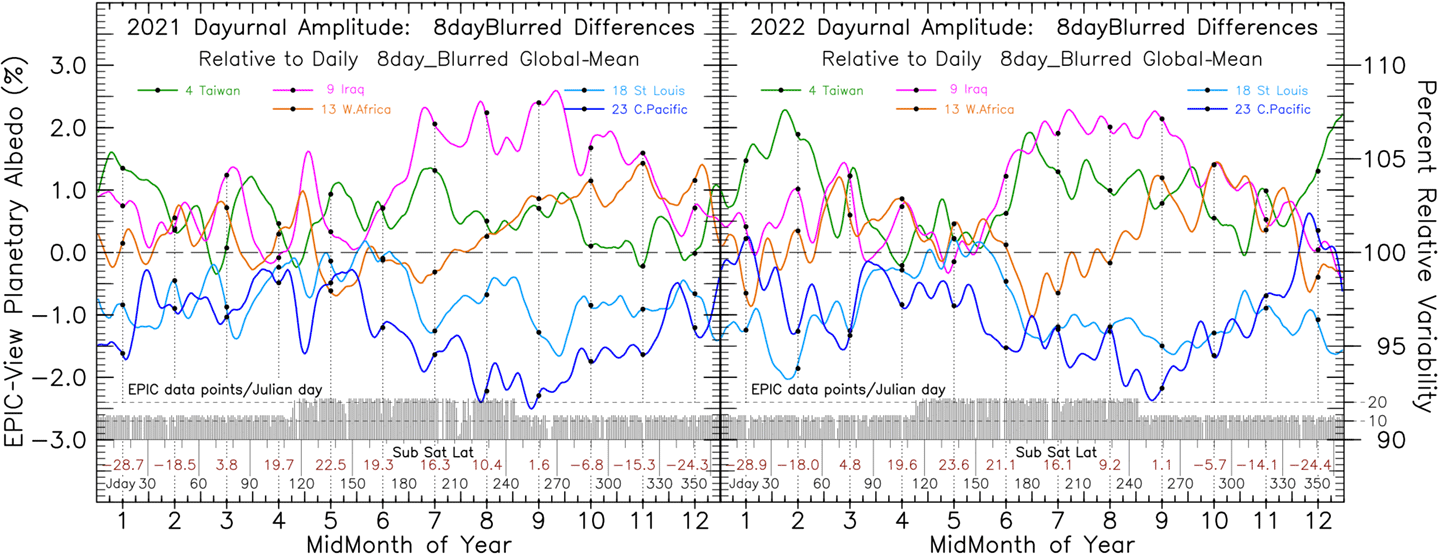
Andrew Lacis [GISS] reported on results of analysis of seven years of EPIC-derived planetary albedo for Earth, which reveal global-scale longitudinal variability occurring over a wide range of frequencies – with strong correlation between nearby longitudes and strong anticorrelation between diametrically opposed longitudes. This behavior in the Earth’s global-scale energy budget variability is fully corroborated by seven years of NISTAR silicon photodiode measurements, which view the Earth with 1º longitudinal resolution. This analysis establishes the DSCOVR mission EPIC/NISTAR measurements as a new and unmatched observational data source for evaluating global climate model performance– e.g., see Figure 2.
Figure 2. This graph shows the diurnal variation in planetary albedo as measured by EPIC for five different eight-day-Blurred Meridians relative to Global Mean for 2021 [left] and 2022 [right].
Figure credit: Andrew Lacis [GISS]
Wenying Su [LaRC] discussed global daytime mean SW fluxes within the EPIC field of view produced from January 2016–June 2024. These quasi-hourly SW fluxes agree very well with the Synoptic data product from the Clouds and the Earth’s Radiant Energy System (CERES) instruments (currently flying on the Terra and Aqua, Suomi NPP, and NOAA-20 platforms) with the root mean square errors (rmse) less than 3 W/m2. This SW flux processing framework will be used to calculate NISTAR SW flux when Version 4 (V4) of the NISTAR radiance becomes available. Su noted that SW fluxes from EPIC are not suitable to study interannual variability as the magnitude of EPIC flux is sensitive to the percentage of daytime area visible to EPIC.
Update on EPIC Products and Science Results
EPIC has a suite of data products available. The following subsections summarize content during the DSCOVR STM related to these products. The updates focus on several data products and the related algorithm improvements.
Total Column Ozone
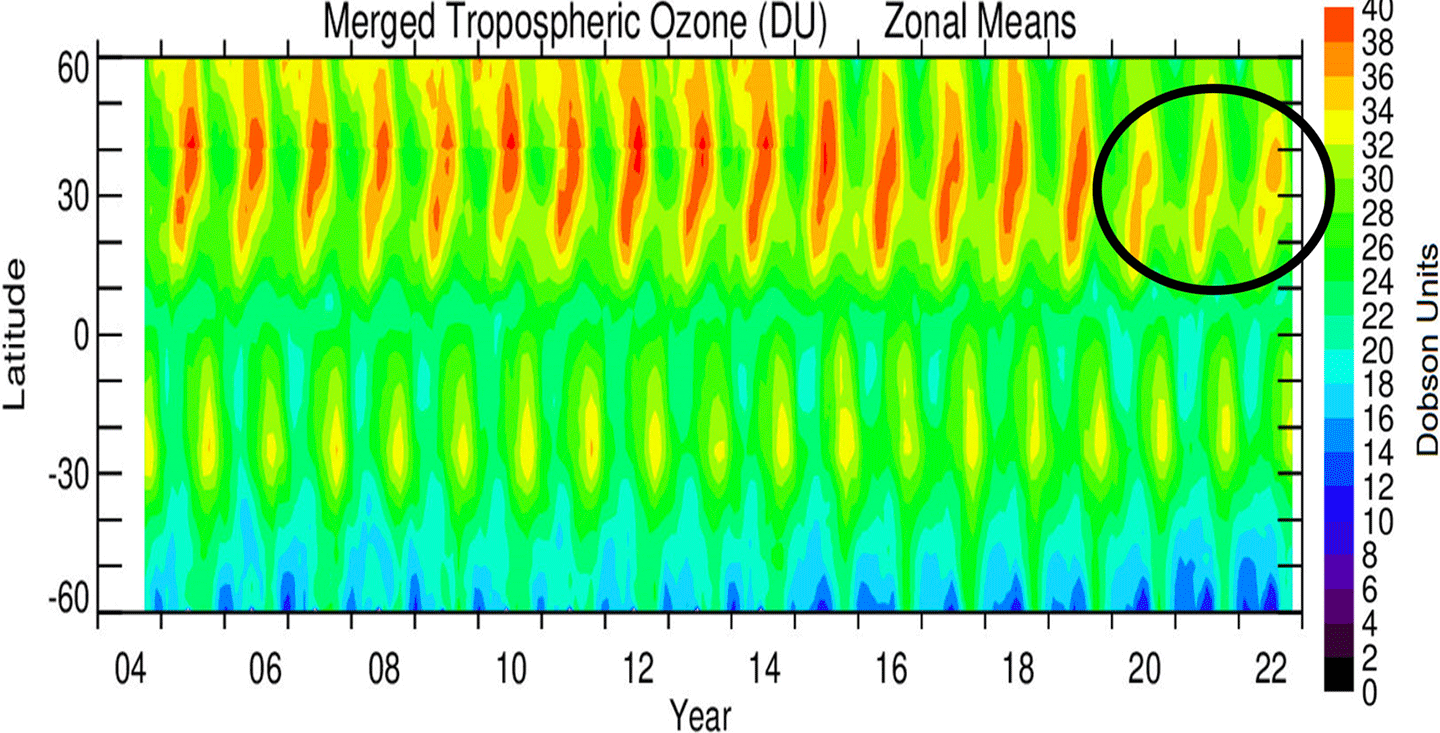
Jerry Ziemke [Morgan State University (MSU), Goddard Earth Sciences Technology and Research–II (GESTAR II)] and Natalya Kramarova [GSFC] reported that tropospheric O3 from DSCOVR EPIC shows anomalous reductions of ~10% throughout the Northern Hemisphere (NH) starting in Spring 2020 that continues to the present. The EPIC data, along with other satellite-based (e.g., Ozone Monitoring Instrument (OMI) on NASA’s Aura platform) and ground-based (e.g., Pandora) data, indicate that the observed NH reductions in O3 are due to combined effects from meteorology and reduced pollution, including reduced shipping pollution in early 2020 (during COVID) – see Figure 3. EPIC 1–2 hourly data are also used to evaluate hourly total O3 and derived tropospheric O3 from NASA’s Tropospheric Emissions: Monitoring of Pollution (TEMPO) geostationary instrument. Ziemke explained that comparison of TEMPO data with EPIC data has helped the researchers characterize a persistent latitude-dependent offset in TEMPO total O3 data of ~10–15% from south to north over the North American continent.
Figure 3. This dataset combines input from EPIC, OMPS, and OMI from 2004–2022. The onset of the COVID-19 pandemic in 2020 can be seen clearly in the data as it corresponds to a sudden drop in tropospheric column ozone by ~3 Dobson Units in the Northern Hemisphere.
Figure credit: Jerry Ziemke (Morgan State University, GESTAR-II)
Algorithm Improvement for Ozone and Sulfur Dioxide Products
Kai Yang [UMD] presented a comprehensive evaluation of total and tropospheric O3 retrievals, highlighting the long-term stability and high accuracy of EPIC measurements. He also validated EPIC’s volcanic sulfur dioxide (SO2) retrievals by comparing them with ground-based Brewer spectrophotometer measurements and summarized EPIC’s observations of SO2 from recent volcanic eruptions.
Simon Carn [University of Michigan] showed the first comparisons between the EPIC L2 volcanic SO2 product and SO2 retrievals from the Geostationary Environment Monitoring Spectrometer (GEMS) on the Korean GEO-Kompsat-2B satellite. GEMS observes East Asia as part of the new geostationary UV air quality (GEO-AQ) satellite constellation (which also includes TEMPO that observes North America and will include the Ultraviolet–Visible–Near Infrared (UVN) instrument on the European Copernicus Sentinel-4 mission, that will be launched in 2025 to observe Europe and surrounding areas) – but is not optimized for measurements of high SO2 columns during volcanic eruptions. EPIC SO2 data for the 2024 eruption of Ruang volcano in Indonesia are being used to validate a new GEMS volcanic SO2 product. Initial comparisons show good agreement between EPIC and GEMS before volcanic cloud dispersal and confirm the greater sensitivity of the hyperspectral GEMS instrument to low SO2 column amounts.
Aerosols
Alexei Lyapustin [GSFC] reported that the latest EPIC aerosols algorithm (V3) simultaneously retrieves aerosol optical depth, aerosol spectral absorption, and aerosol layer height (ALH) – achieving high accuracy. He showed that global validation of the single scattering albedo in the blue and red shows 66% and 81–95% agreement respectively, with Aerosol Robotic Network (AERONET) observations – which is within the expected error of 0.03 for smoke and dust aerosols. Lyapustin also reported on a comparison of EPIC aerosol data collected from 2015–2023 by the Cloud-Aerosol Lidar with Orthogonal Polarization (CALIOP), which flew on the Cloud-Aerosol Lidar and Infrared Pathfinder Satellite Observations (CALIPSO) mission. The results show that ALH is retrieved with rmse ~1.1 km (0.7 mi). ALH is unbiased over the ocean and is underestimated by 450 m (1470 ft) for the smoke and by 750 m (2460 ft) for the dust aerosols over land.
Myungje Choi and Sujung Go [both from University of Maryland, Baltimore County’s (UMBC), GESTAR II] presented results from a global smoke and dust characterization using Multi-Angle Implementation of Atmospheric Correction (MAIAC) algorithm. This study characterized smoke and dust aerosol properties derived from MAIAC EPIC processing, examining spectral absorption, ALH, and chemical composition (e.g., black and brown carbon). Regions with smoldering wildfires, e.g., North America and Siberia, exhibited high ALH and a significant fraction of brown carbon, while Central Africa showed lower ALH with higher black carbon emissions.
Omar Torres [GSFC] discussed how L1 DSCOVR-EPIC observations are being used to study air quality (i.e., tropospheric O3 and aerosols) globally. Torres noted that this application of EPIC-L1 observations is of particular interest in the Southern Hemisphere (SH) where, unlike over the NH, there are currently no space GEO-based air quality measurements – and no plans for them in the foreseeable future.
Hiren Jethva [MSU, GESTAR II] presented the new results of the aerosol optical centroid height retrieved from the EPIC Oxygen-B band observations. He described the algorithm details, showed retrieval maps, and reviewed the comparative analysis against CALIOP backscatter-weighted measurements. The analysis showed a good level of agreement with more than 70% of matchup data within 1–1.5 km (0.6–0.9 mi) difference.
Jun Wang [University of Iowa] presented his team’s work on advancing the second generation of the aerosol optical centroid height (AOCH) algorithm for EPIC. Key advancements included: constraining surface reflectance in aerosol retrieval using an EPIC-based climatology of surface reflectance ratios between 442–680 nm; incorporating a dynamic aerosol model to characterize aged smoke particles; and employing a spectral slope technique to distinguish thick smoke plumes from clouds. Results show that both atmospheric optical depth (AOD) and AOCH retrievals are improved in the second generation of AOCH algorithm.
Olga Kalashnikova[NASA/Jet Propulsion Laboratory (JPL)] reported on improving brown carbon evolution processes in the Weather Research and Forecasting model coupled with Chemistry (WRF-Chem) model with EPIC products. She indicated that DSCOVR product evaluation, using lidar aerosol height measurements from CALIOP, led to an improved operational brown carbon product. To better resolve the temporal evolution of brown carbon, chemical transport models need to include more information about near-source fires.
Mike Garay[NASA/Jet Propulsion Laboratory (JPL)] discussed constraining near-source brown carbon emissions from 2024 Canadian ‘zombie’ fires with EPIC products. He reported that fires in British Columbia, Canada showed differences in brown carbon emission near the sources. Garay explained that their investigation has revealed that these differences were related to fire intensity and variations in vegetation/soil content.
Yuekui Yang [GSFC] presented work that examined the impact of Earth’s curvature consideration on EPIC cloud height retrievals. Biases under the Plane Parallel (PPL) assumption is studied by comparing results using the improved pseudo-spherical shell approximation. PPL retrievals in general bias high and for a cloud with height of 5 km (3 mi), the bias is about 6%.
Alfonso Delgado Bonal [UMBC] stated that the EPIC vantage point offers a unique opportunity to observe not only the current state of the Earth but also its temporal evolution. By capturing multiple observations of the planet throughout the day, EPIC enables statistical reconstruction of diurnal patterns in clouds and other atmospheric parameters. Bonal’s team focused their research on O3 (primarily tropospheric) over the U.S. to demonstrate the presence of a diurnal cycle in the western regions of the continental U.S. However, ground-based data from PANDORA for specific locations do not support these diurnal variations – underscoring the critical role of space-based O3 retrievals. The proposed methodology is not limited to clouds or O3 but is broadly applicable to other EPIC measurements for the dynamic nature of our planet.
Elizabeth Berry [Atmospheric and Environmental Research (AER)] presented results from a coincident DSCOVR–CloudSat dataset [covering 2015–2020]. Cloud properties (e.g., cloud height and optical depth) from DSCOVR and CloudSat are moderately correlated and show quite good agreement given differences in the instruments sensitivities and footprints. Berry explained that a machine-learning model trained on the coincident data demonstrates high accuracy at predicting the presence of vertical cloud layers. However, precision and recall metrics highlight the challenge of predicting the precise location of cloud boundaries.
Anthony Davis [JPL] presented a pathway toward accurate estimation of the cloud optical thickness (COT) of opaque clouds and cloud systems, e.g., supercells, mesoscale convective complexes, and tropical cyclones (TCs). He described the approach, which uses differential oxygen absorption spectroscopy (DOAS) that has resolving power greater than 104 – which is comparable to that of the high-resolution spectrometers on NASA’s Orbiting Carbon Observatory–2 (OCO-2) – but is based upon the cloud information content of EPIC’s O2 A- and B-band radiances. Unlike the current operational retrieval of COT – which uses data from the Moderate Resolution Imaging Spectroradiometer (MODIS) on Terra and Aqua – the DOAS-based technique does not saturate at COT exceeding ~60. According to a popular TC model with two-moment microphysics, COT in a tropical storm or hurricane can reach well into the hundreds, sometimes exceeding 1000. Davis said that once the new COT estimates become available, they will provide new observational constraints on process and forecast models for TCs.
Ocean
Robert Frouin [Scripps Institution of Oceanography, University of California] discussed ocean surface radiation products derived from EPIC data. He explained that significant advancements have been achieved in processing and evaluating ocean biology and biogeochemistry products derived from EPIC imagery. V1 updates enhanced accuracy by integrating Modern-Era Retrospective analysis for Research and Applications V2 (MERRA-2) ancillary data and refining calculations for atmospheric and surface parameters. Frouin introduced several diurnal products, including hourly photosynthetically active radiation (PAR) fluxes, spectral water reflectance, and chlorophyll-a concentrations. He said that these new MODIS-derived products have been validated through comparisons with data from the Advanced Himawari Imager on the Japanese Himawar–8 and –9 satellites. In order to address the gaps in these diurnal products, Frouin explained that the team developed a convolutional neural network that has been used effectively to reconstruct missing PAR values with high accuracy.
Vegetation
Yuri Knyazikhin [Boston University] reported on the status of the Vegetation Earth System Data Record (VESDR) that provides a variety of parameters including: Leaf Area Index (LAI), diurnal courses of Normalized Difference Vegetation Index (NDVI), Sunlit LAI (SLAI), Fraction of incident Photosynthetically Active Radiation (FPAR) absorbed by the vegetation, Directional Area Scattering Function (DASF), Earth Reflector Type Index (ERTI), and Canopy Scattering Coefficient (CSC). Knyazikhin discussed analysis of the diurnal and seasonal variations of these quantities. EPIC LAI and FPAR are consistent with MODIS-derived measurements of the same parameters.
Jan Pisek [University of Tartu/Tartu Observatory, Estonia] discussed efforts to derive leaf inclination information from EPIC data. The very first evaluation over Tumbarumba site (in New South Wales, Australia) showed that the angular variation in parameters obtained from EPIC reflects the expected variations due to the erectophile vegetation present at the site.
Sun Glint
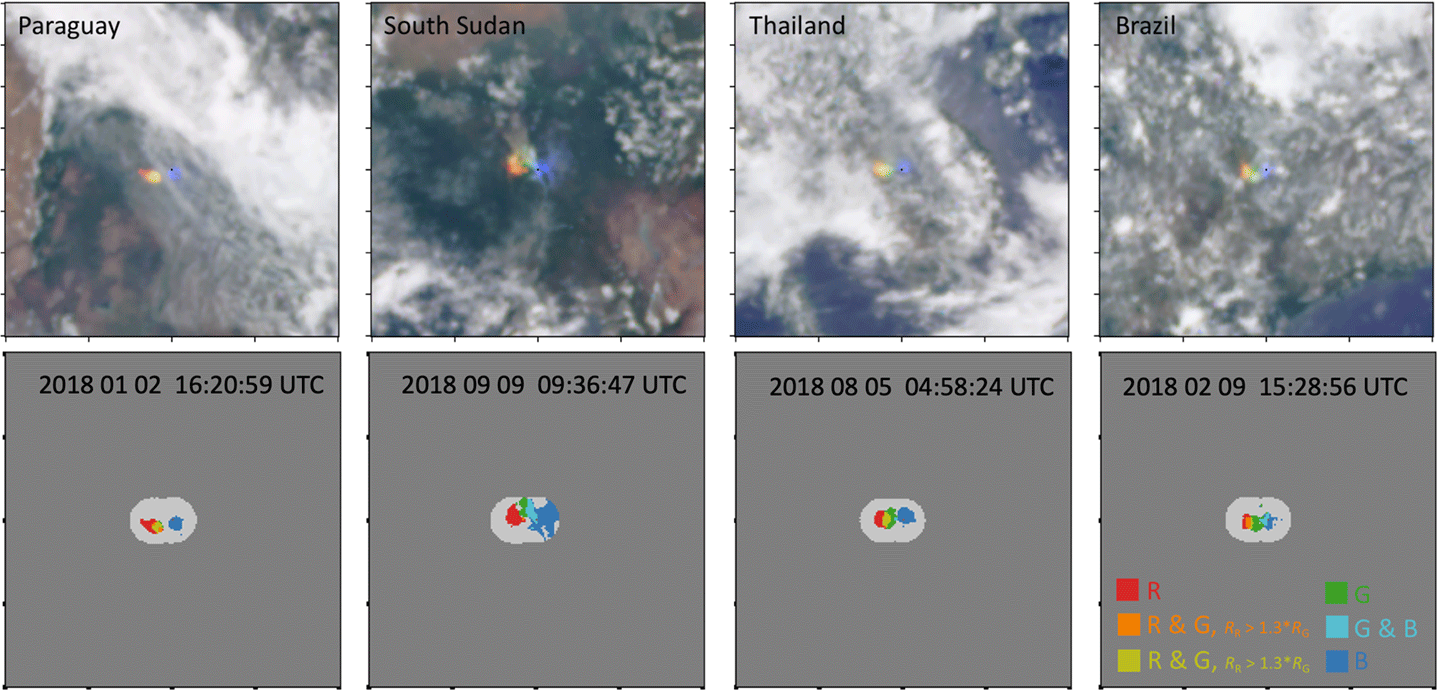
Tamás Várnai [UMBC, JCET] discussed EPIC observations of Sun glint from ice clouds. The cloud glints come mostly from horizontally oriented ice crystals and have strong impact in EPIC cloud retrievals. Várnai reported that the EPIC glint product is available from the ASDC – see Figure 4. Glint data can help reduce the uncertainties related to horizontally oriented ice crystals and yield additional new insights about the microphysical and radiative properties of ice clouds.
Figure 4. [top row] EPIC glint mask examples over land in [left to right] Paraguay, Sudan, Thailand, and Brazil. [bottom row] The corresponding EPIC glint mask for each image on the top row indicates the band (red, green and blue) and the size of sun glint for each of them.
Figure credit: Tamás Várnai (University of Maryland, Baltimore County)
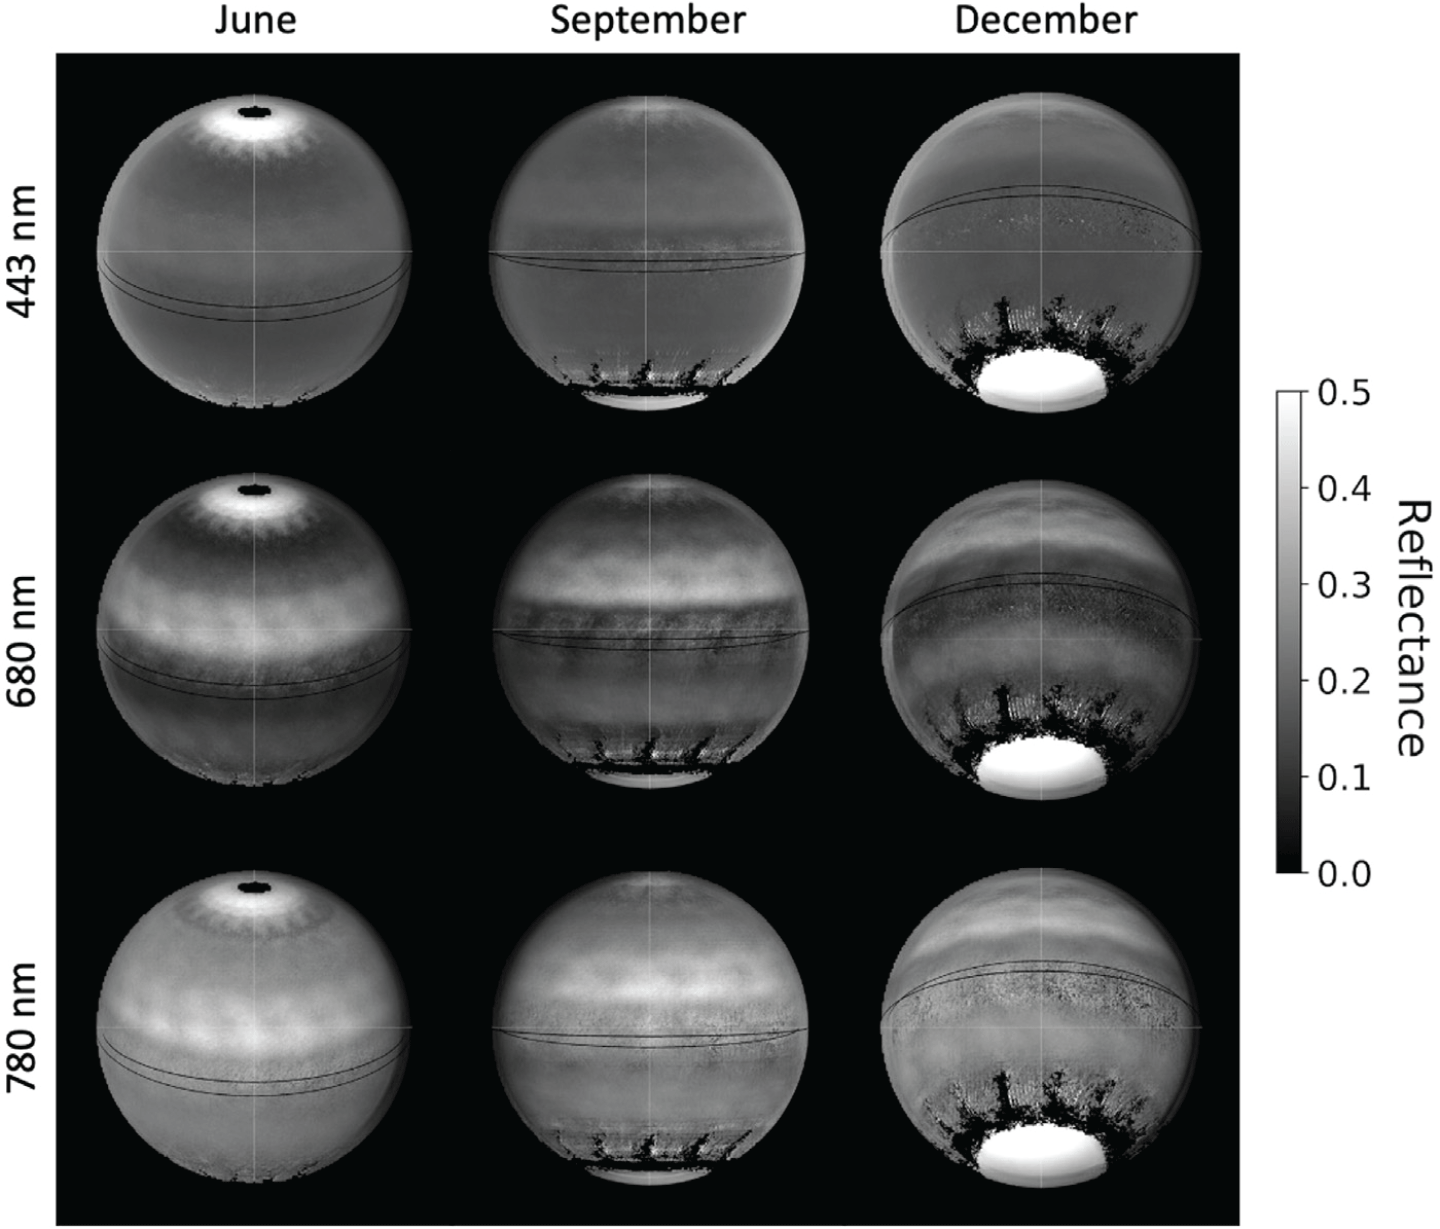
Alexander Kostinski [Michigan Technology University] explained that because they detected climatic signals (i.e., longer-term changes and semi-permanent features, e.g., ocean glitter), they developed a technique to suppress geographic “noise” in EPIC images that involves introducing temporally (monthly) and conditionally (classifying by surface/cover type, e.g., land, ocean, clouds) averaged reflectance images – see Figure 5. The resulting images display seasonal dependence in a striking manner. Additionally, cloud-free, ocean-only images highlight prominent regions of ocean glitter.
Figure 5. Monthly reflectances for clear land pixels. Earth masquerading as Jupiter; latitudinal bright bands are caused by features such as the Sahara and Antarctica. Black spots are due to the lack or dearth of clear land pixels at that latitude. Repeated spots within latitudinal bands reflect roughly bi-hourly image sampling.
Figure credit: Alexander Kostinski (Michigan Technology University); from a 2024 paper published in Frontiers of Remote Sensing
Jiani Yang [Caltech] reported that spatially resolving light curves from DSCOVR is crucial for evaluating time-varying surface features and the presence of an atmosphere. Both of these features are essential for sustaining life on Earth – and thus can be used to assess the potential habitability of exoplanets. Using epsilon machine reconstruction, the statistical complexity from the time series data of these light curves can be calculated. The results show that statistical complexity serves as a reliable metric for quantifying the intricacy of planetary features. Higher levels of planetary complexity qualitatively correspond to increased statistical complexity and Shannon entropy, illustrating the effectiveness of this approach in identifying planets with the most dynamic characteristics.
Other EPIC Science Results
Guoyong Wen [MSU, GESTAR II] analyzed the variability of global spectral reflectance from EPIC and the integrated broadband reflectance on different timescales. He reported that on a diurnal timescale, the global reflectance variations in UV and blue bands are statistically similar – and drastically different from those observed in longer wavelength bands (i.e., green to NIR). The researchers also did an analysis of monthly average results and found that temporal averaging of the global reflectance reduces the variability across the wavelength and that the variability of broadband reflectance is similar to that for the red band on both timescales. These results are mainly due to the rotation of the Earth on diurnal timescale and the change of the Earth’s tilt angle.
Nick Gorkavyi [Science Systems and Applications, Inc. (SSAI)] reported that EPIC – located at the L1 point, 1.5 million km (0.9 million mi) away from Earth – can capture images of the far side of the Moon in multiple wavelengths. These images, taken under full solar illumination, can be used to calibrate photographs obtained by lunar artificial satellites. Additionally, he discussed the impact of lunar libration – the changing view of the Moon from Earth, or it’s apparent “wobble” – on Earth observations from the Moon.
Jay Herman [UMBC] discussed a comparison of EPIC O3 with TEMPO satellite and Pandora ground-based measurement. The results show that total column O3 does not have a significant photochemical diurnal variation. Instead, the daily observed diurnal variation is caused by weather changes in atmospheric pressure. This measurement result agrees with model calculations.
Conclusion
Alexander Marshak, Jay Herman, and Adam Szabo led a closing discussion with ST participants on how to make the EPIC and NISTAR instruments more visible in the community. It was noted that the EPIC website now allows visitors to observe daily fluctuations of aerosol index, cloud fraction, cloud height, and the ocean surface – as observed from the L1 point. More daily products, (e.g., aerosol height and sunlit leaf area index) will be added soon, which should attract more users to the website.
Overall, the 2023 DSCOVR EPIC and NISTAR STM was successful. It provided an opportunity for participants to learn the status of DSCOVR’s Earth-observing instruments, EPIC and NISTAR, the status of recently released L2 data products, and the science results being achieved from the L1 point. As more people use DSCOVR data worldwide, the ST hopes to hear from users and team members at its next meeting. The latest updates from the mission can be found on the EPIC website.
Firefly’s Blue Ghost lunar lander captured a bright image of the Moon’s South Pole (on the far left) through the cameras on its top deck, while it travels to the Moon as part of NASA’s CLPS (Commercial Lunar Payload Services) initiative and Artemis campaign.
Credits: Firefly Aerospace
With a suite of NASA science and technology on board, Firefly Aerospace is targeting no earlier than 3:45 a.m. EST on Sunday, March 2, to land the Blue Ghost lunar lander on the Moon. Blue Ghost is slated to touch down near Mare Crisium, a plain in the northeast quadrant on the near side of the Moon, as part of NASA’s CLPS (Commercial Lunar Payload Services) initiative and Artemis campaign to establish a long-term lunar presence.
Live coverage of the landing, jointly hosted by NASA and Firefly, will air on NASA+ starting at 2:30 a.m. EST, approximately 75 minutes before touchdown on the Moon’s surface. Learn how to watch NASA content through a variety of platforms, including social media. The broadcast will also stream on Firefly’s YouTube channel. Coverage will include live streaming and blog updates as the descent milestones occur.
Accredited media interested in attending the in-person landing event hosted by Firefly in the Austin, Texas, area may request media credentials through this form by Monday, Feb. 24.
Following the landing, NASA and Firefly will host a news conference to discuss the mission and science opportunities that lie ahead as they begin lunar surface operations. The time of the briefing will be shared after touchdown.
Blue Ghost launched Jan. 15, at 1:11 a.m. EST on a SpaceX Falcon 9 rocket from Launch Complex 39A at NASA’s Kennedy Space Center in Florida. The lander is carrying a suite of 10 NASA scientific investigations and technology demonstrations, which will provide insights into the Moon’s environment and test technologies to support future astronauts landing safely on the lunar surface, as well as Mars.
NASA continues to work with multiple American companies to deliver science and technology to the lunar surface through the agency’s CLPS initiative. This pool of companies may bid on contracts for end-to-end lunar delivery services, including payload integration and operations, launching from Earth, and landing on the surface of the Moon. NASA’s CLPS contracts are indefinite-delivery/indefinite-quantity contracts with a cumulative maximum value of $2.6 billion through 2028. In February 2021, the agency awarded Firefly this delivery of 10 NASA science investigations and technology demonstrations to the Moon using its American-designed and -manufactured lunar lander for approximately $93.3 million (modified to $101.5 million).
Through the Artemis campaign, commercial robotic deliveries will perform science experiments, test technologies, and demonstrate capabilities on and around the Moon to help NASA explore in advance of Artemis Generation astronaut missions to the lunar surface, and ultimately crewed missions to Mars.
Watch, engage on social media
Let people know you’re following the mission on X, Facebook, and Instagram by using the hashtag #Artemis. You can also stay connected by following and tagging these accounts:
An Afternoon of Family Science and Rocket Exploration in Alaska
On Tuesday, January 28th, Fairbanks BEST Homeschool joined the Geophysical Institute for an afternoon of rocket exploration, hands-on activities, and stargazing inside a planetarium. This event was free and open to the public. Despite their frigid winter weather, 200 attendees were curious about the scientific endeavors of Alaska-based researchers alongside cutting-edge investigations conducted by NASA rocket scientists.
This event was offered to the community in association with the Science For Alaska Lecture Series and the 2025 NASA Sounding Rocket campaign. Every attendee left with something inspiring to think about. Parents and educators interested in learning more about auroras and do participatory science may check out NASA’s Aurorasauruscitizen science project.
The Geophysical Institute at the University of Alaska Fairbanks is a Co-Investigating team for the NASA Heliophysics Education Activation Team (NASA HEAT), which is part of NASA’s Science Activation Portfolio. Learn more about how Science Activation connects NASA science experts, content, and experiences with community leaders to do science in ways that activate minds and promote deeper understanding of our world and beyond: https://science.nasa.gov/learn
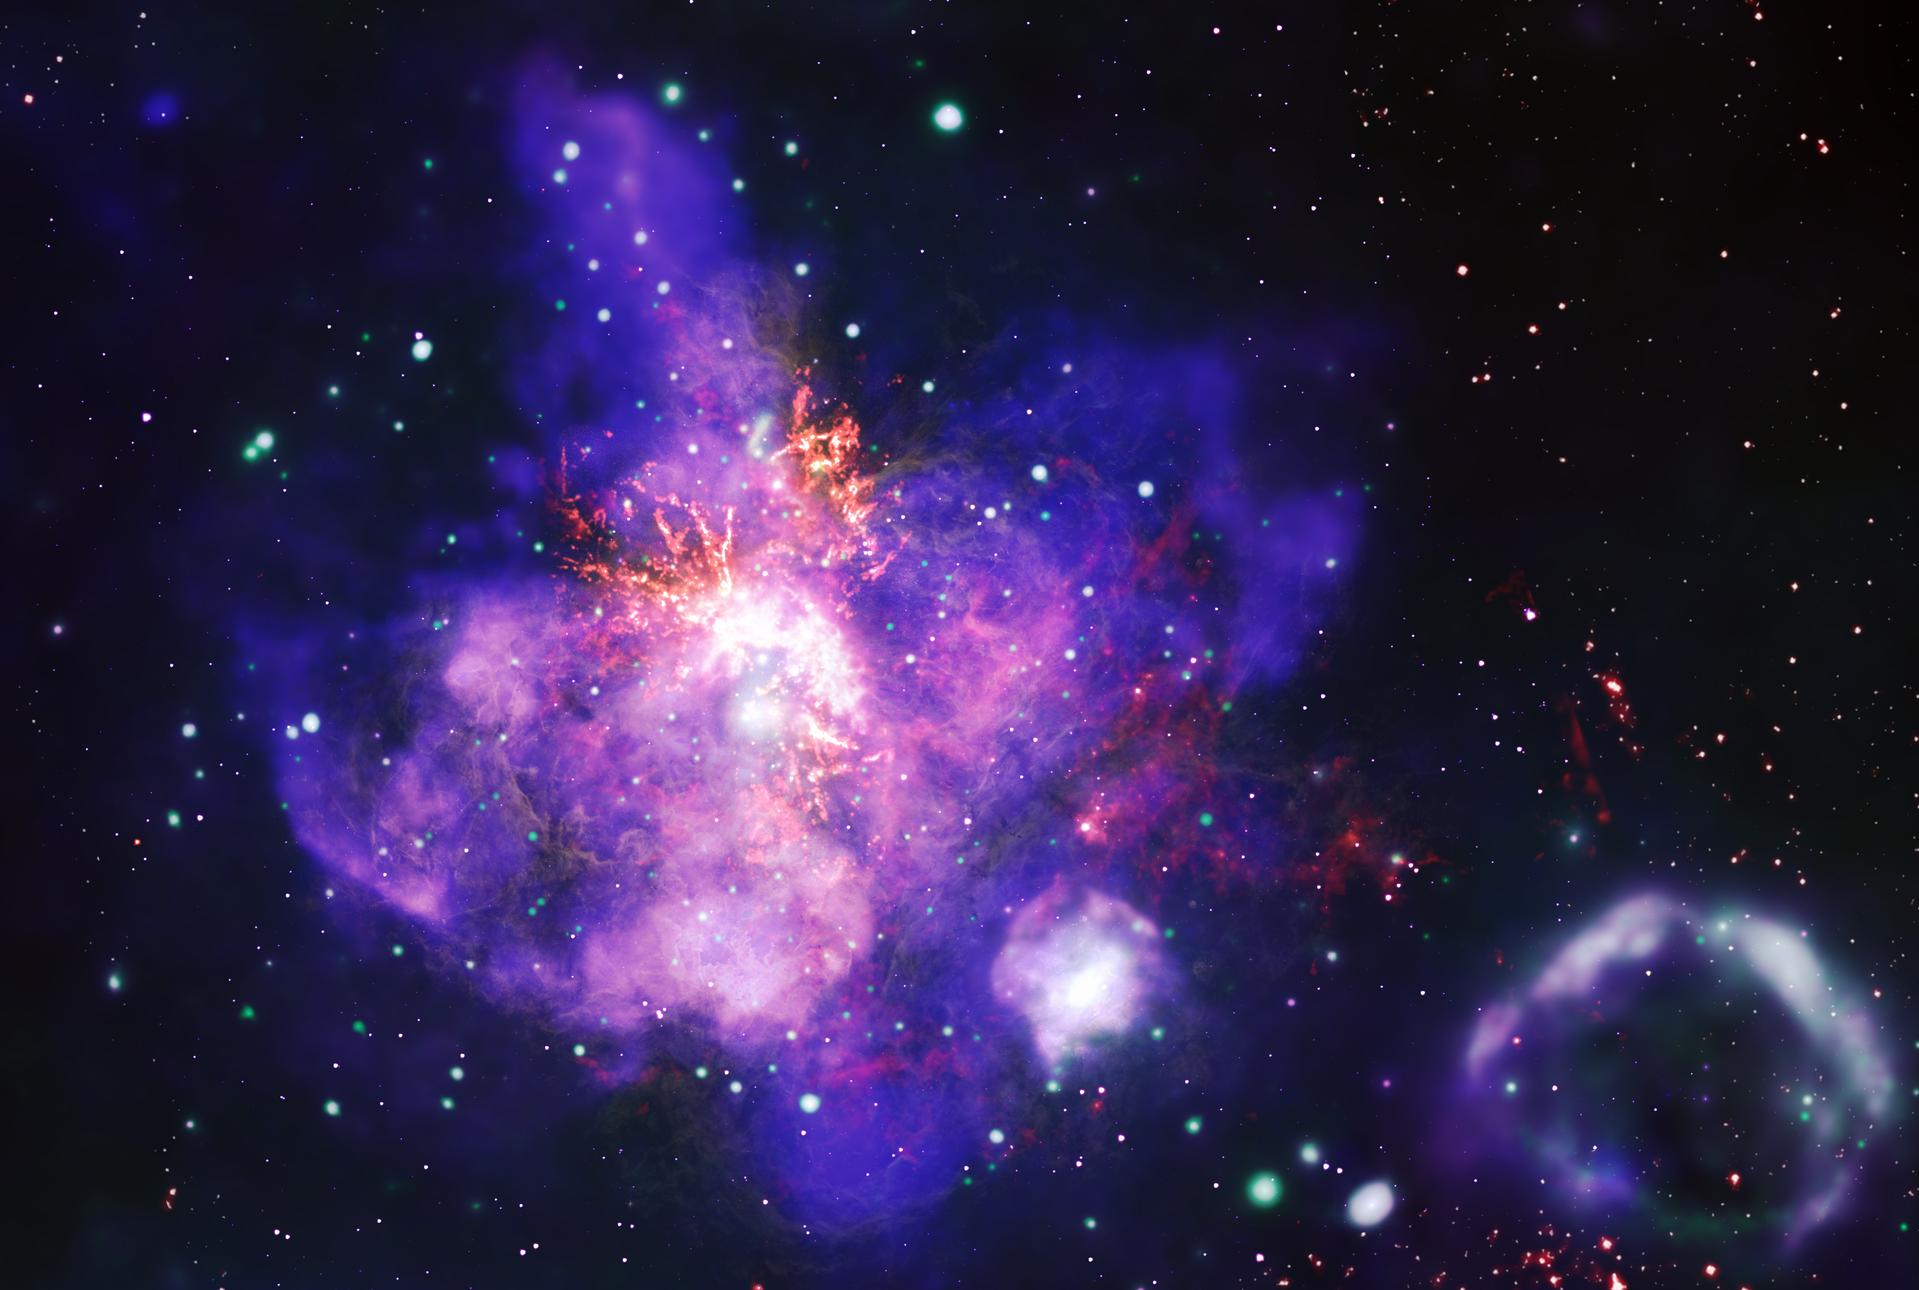
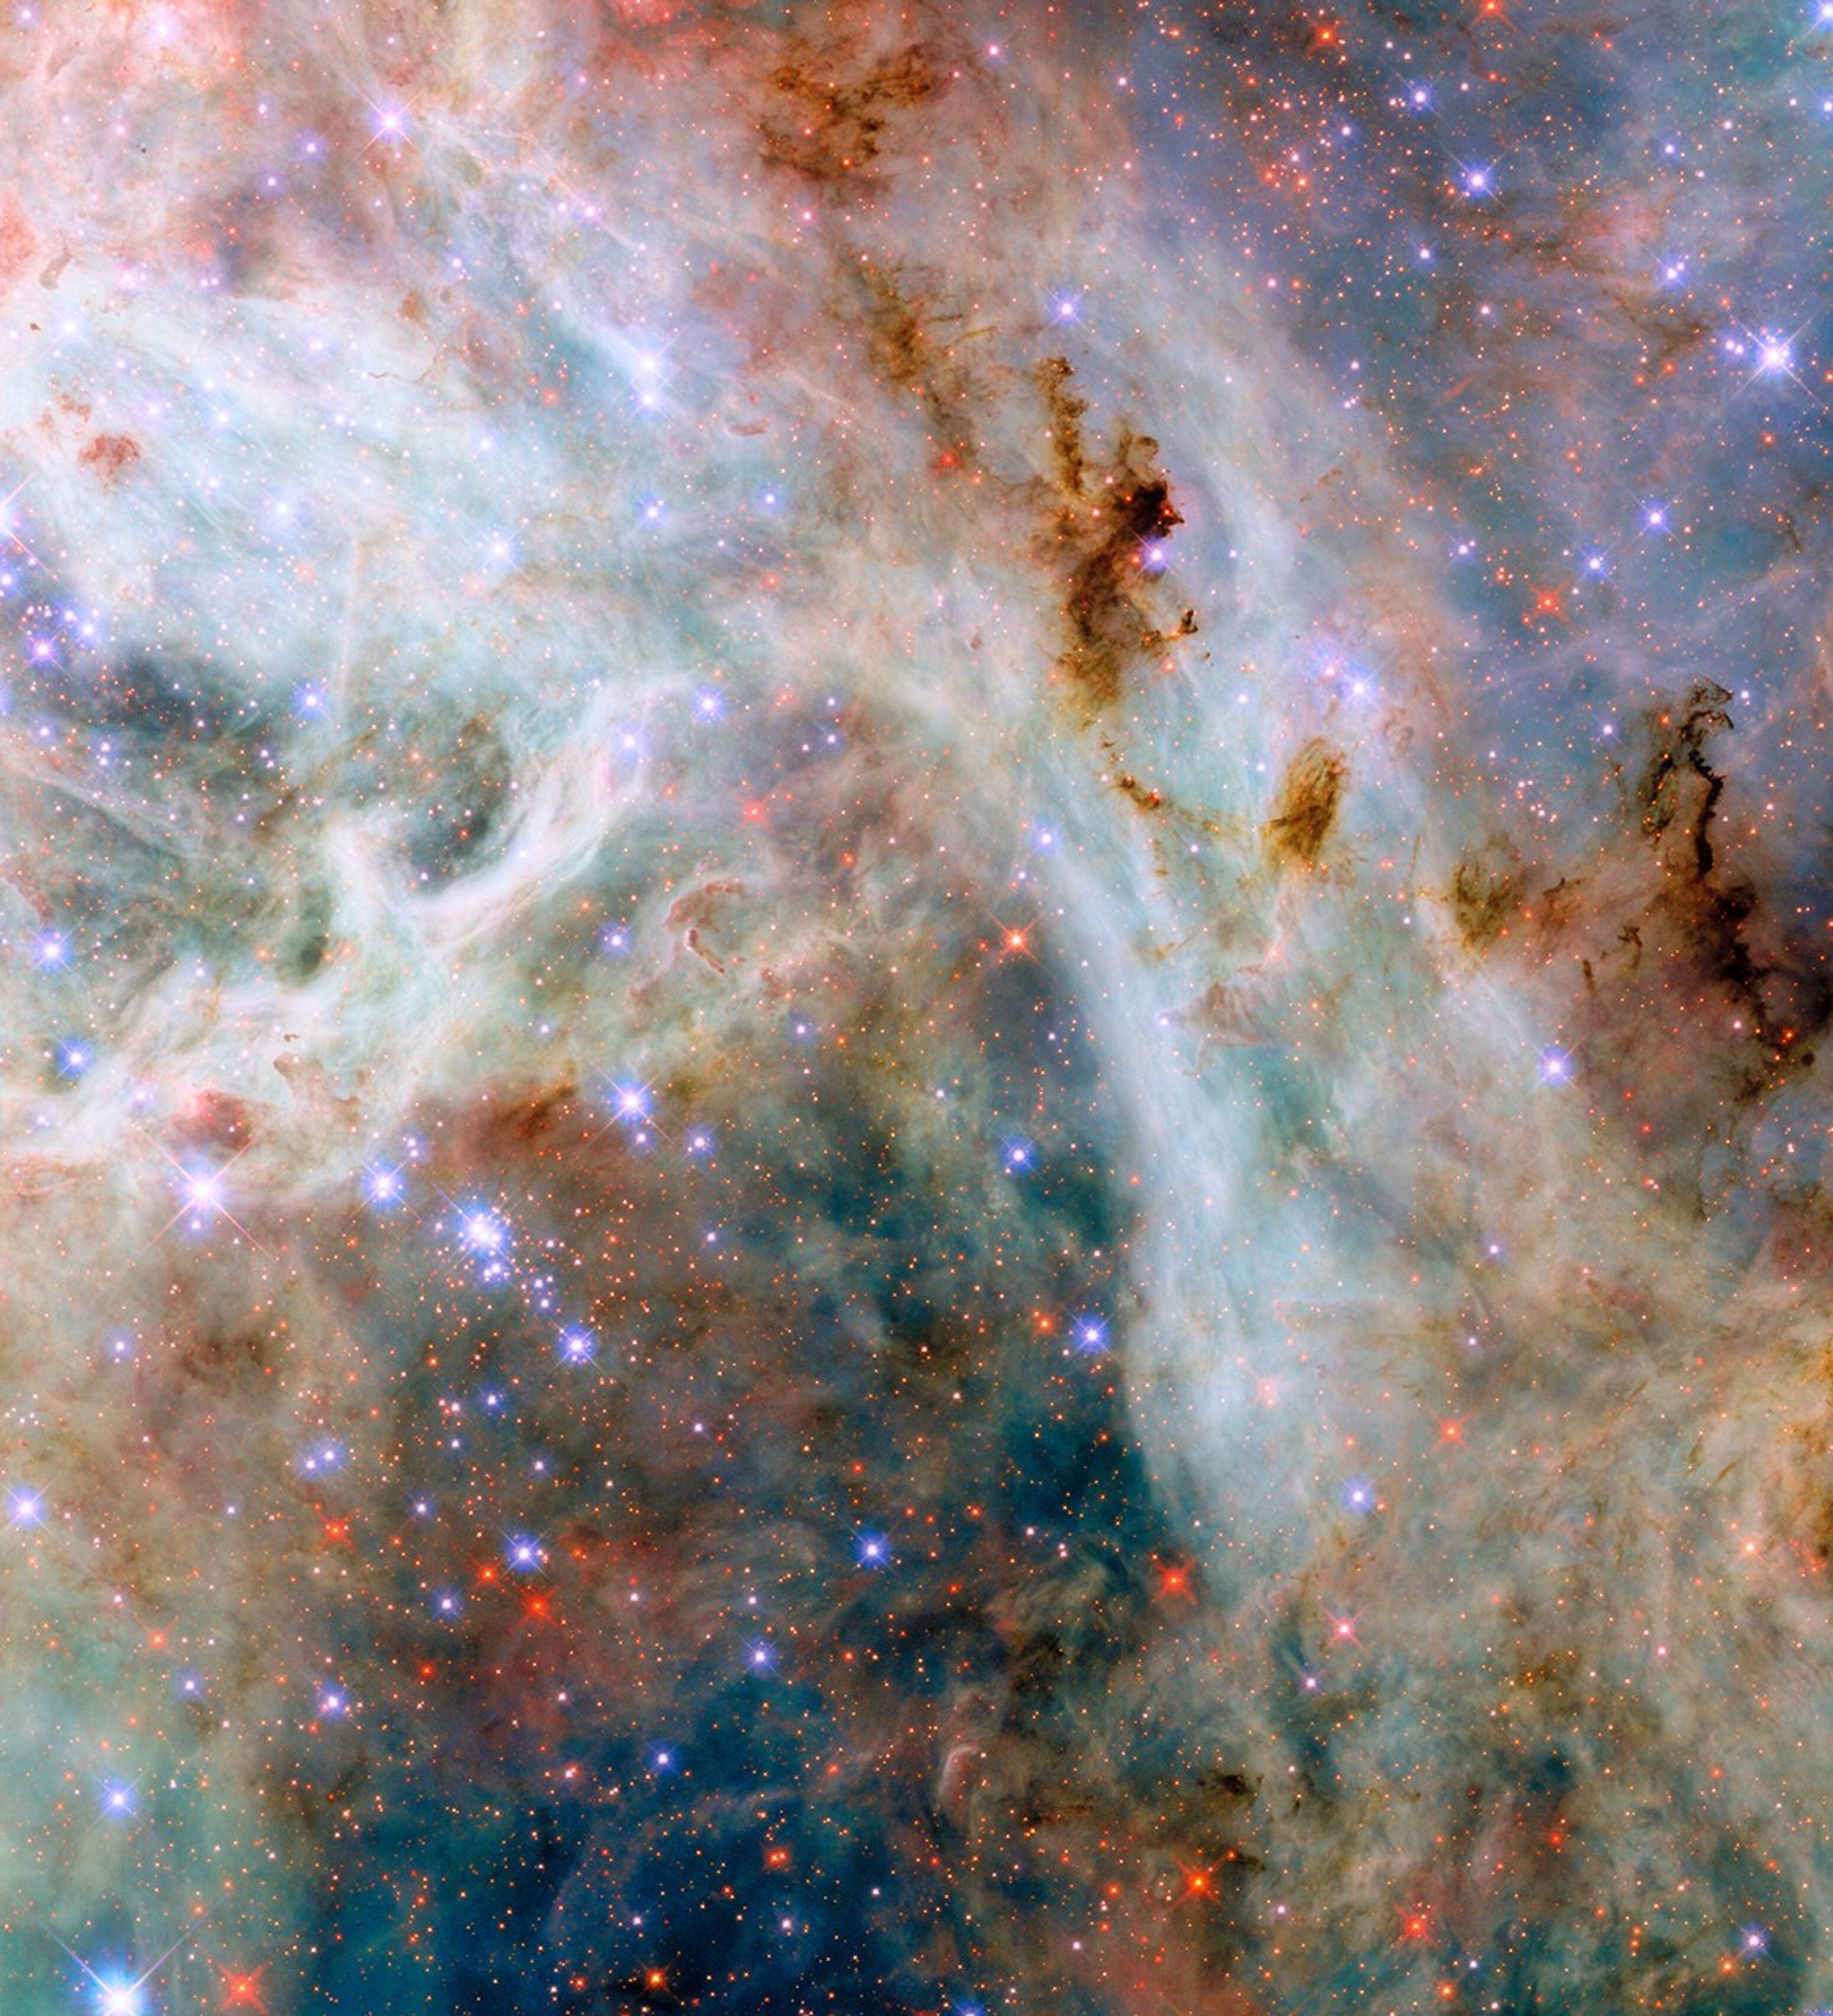
Otherwise known as the Tarantula Nebula, 30 Dor is located about 160,000 light-years away in a small neighboring galaxy to the Milky Way known as the Large Magellanic Cloud. Because it one of the brightest and populated star-forming regions to Earth, 30 Dor is a frequent target for scientists trying to learn more about how stars are born.
This NASA/ESA Hubble Space Telescope reveals clouds of gas and dust near the Tarantula Nebula, located in the Large Magellanic Cloud about 160,000 light-years away.
The universe is a dusty place, as this NASA/ESA Hubble Space Telescope image featuring swirling clouds of gas and dust near the Tarantula Nebula reveals. Located in the Large Magellanic Cloud about 160,000 light-years away in the constellations Dorado and Mensa, the Tarantula Nebula is the most productive star-forming region in the nearby universe, home to the most massive stars known.
The nebula’s colorful gas clouds hold wispy tendrils and dark clumps of dust. This dust is different from ordinary household dust, which may include of bits of soil, skin cells, hair, and even plastic. Cosmic dust is often comprised of carbon or of molecules called silicates, which contain silicon and oxygen. The data in this image was part of an observing program that aims to characterize the properties of cosmic dust in the Large Magellanic Cloud and other nearby galaxies.
Dust plays several important roles in the universe. Even though individual dust grains are incredibly tiny, far smaller than the width of a single human hair, dust grains in disks around young stars clump together to form larger grains and eventually planets. Dust also helps cool clouds of gas so that they can condense into new stars. Dust even plays a role in making new molecules in interstellar space, providing a venue for individual atoms to find each other and bond together in the vastness of space.
NASA’s Mars rover Curiosity acquired this image of the science targets before it, including “Catalina Island,” the flat rock at image center, using its Left Navigation Camera. The rover captured the image on sol 4450 — or Martian day 4,450 of the Mars Science Laboratory mission — on Feb. 11, 2025, at 13:11:14 UTC.
NASA/JPL-Caltech
Earth planning date: Wednesday, Feb. 12, 2025
I woke up this morning to my weather app telling me it felt like minus 15° C (5°F) outside. On days like this, it can take me a little longer to get myself up and out into the world. Curiosity has a similar problem — as we head toward winter and it gets colder and colder in Gale Crater, Curiosity has to spend more time warming up to do things like driving and all our good science. I’ve also been watching a couple winter storms that are expected in the next few days here in Toronto. Luckily, Curiosity doesn’t have to deal with snowstorms, and our drive in the last plan went ahead as planned and put us in a good position to go ahead with contact science today, a relief after having to forego it on Monday.
The contact science location that the geology team chose is called “Catalina Island,” the flat rock you can see in almost the center of the image above. As you can likely also see above, there’s a whole jumble of rocks in that image, and Mastcam and ChemCam have picked out a couple others to take a look at. These are “Point Dume,” which will be the target of ChemCam’s laser spectrometer, and “Whittier Narrows,” on which Mastcam will image some linear features. Mastcam and ChemCam are also turning their gazes further afield for Mastcam targets “Cleghorn Ridge,” “Cuyamaca Peak,” “Kratka Ridge,” and two long-distance ChemCam mosaics of the top of the Wilkerson butte and a spot a little further down known as “Pothole Trail.”
Much like I’m keeping an eye out the window on the changing weather here, Curiosity is also continuing to keep an eye on the environment in Gale Crater. Even though it’s not the dusty season, we continue to monitor the dust around us and in the atmosphere with a dust-devil survey and a tau. But we’re especially interested in what the clouds are up to right now, which we’re checking in on with our normal zenith and suprahorizon movies, and our cloud-season-only Phase Function Sky Survey. This is a series of movies covering the whole sky that we can use to determine how sunlight interacts with the individual water-ice crystals in the clouds.
Written by Alex Innanen, Atmospheric Scientist at York University