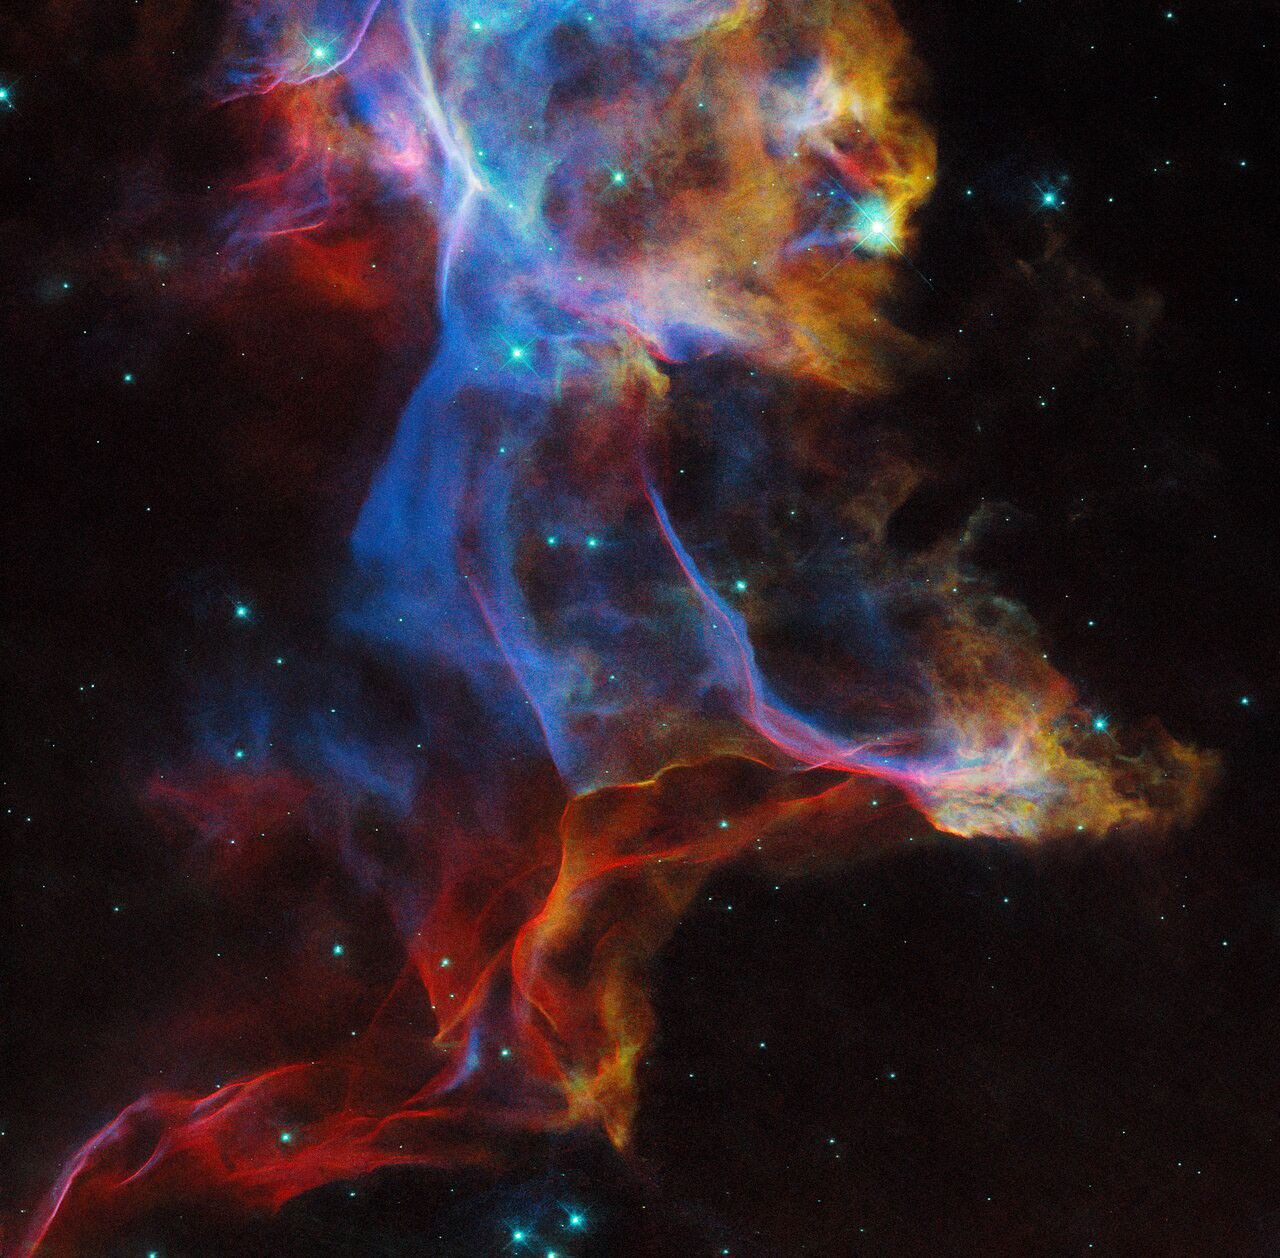
In this NASA/ESA Hubble Space Telescope image, Hubble once again lifts the veil on a famous — and frequently photographed — supernova remnant: the Veil Nebula. The remnant of a star roughly 20 times as massive as the Sun that exploded about 10,000 years ago, the Veil Nebula is situated about 2,400 light-years away in the constellation Cygnus. Hubble images of this photogenic nebula were first taken in 1994 and 1997, and again in 2015.
This view combines images taken in three different filters by Hubble’s Wide Field Camera 3, highlighting emission from hydrogen, sulfur, and oxygen atoms. The image shows just a small fraction of the Veil Nebula; if you could see the entire nebula without the aid of a telescope, it would be as wide as six full Moons placed side-by-side.
Although this image captures the Veil Nebula at a single point in time, it helps researchers understand how the supernova remnant evolves over decades. Combining this snapshot with Hubble observations from 1994 will reveal the motion of individual knots and filaments of gas over that span of time, enhancing our understanding of this stunning nebula.
NASA’s Hubble Provides Bird’s-Eye View of Andromeda Galaxy’s Ecosystem
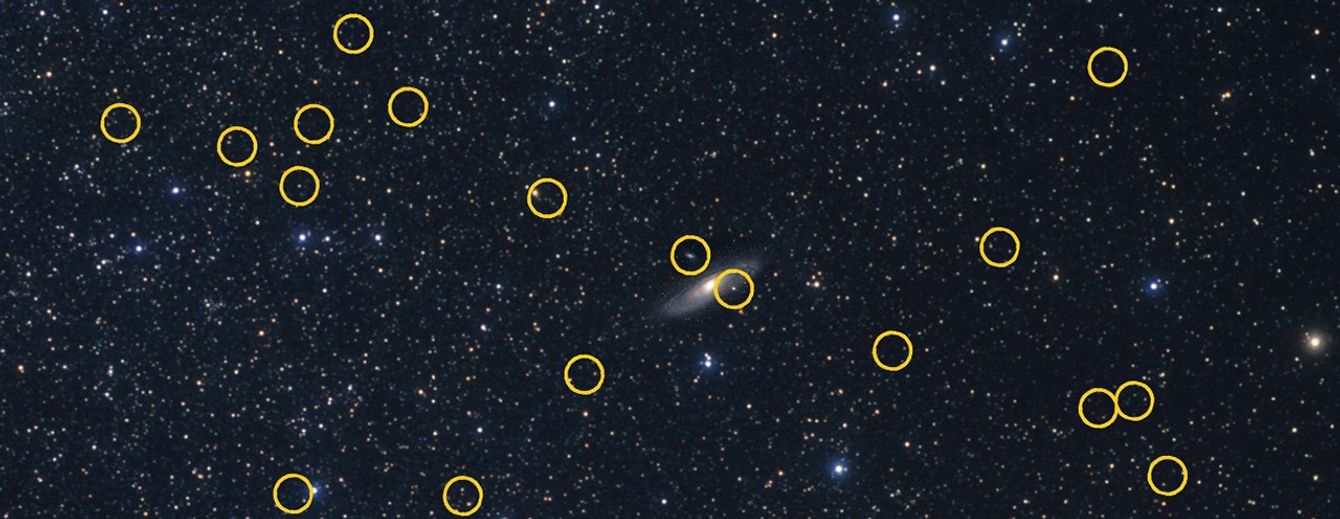
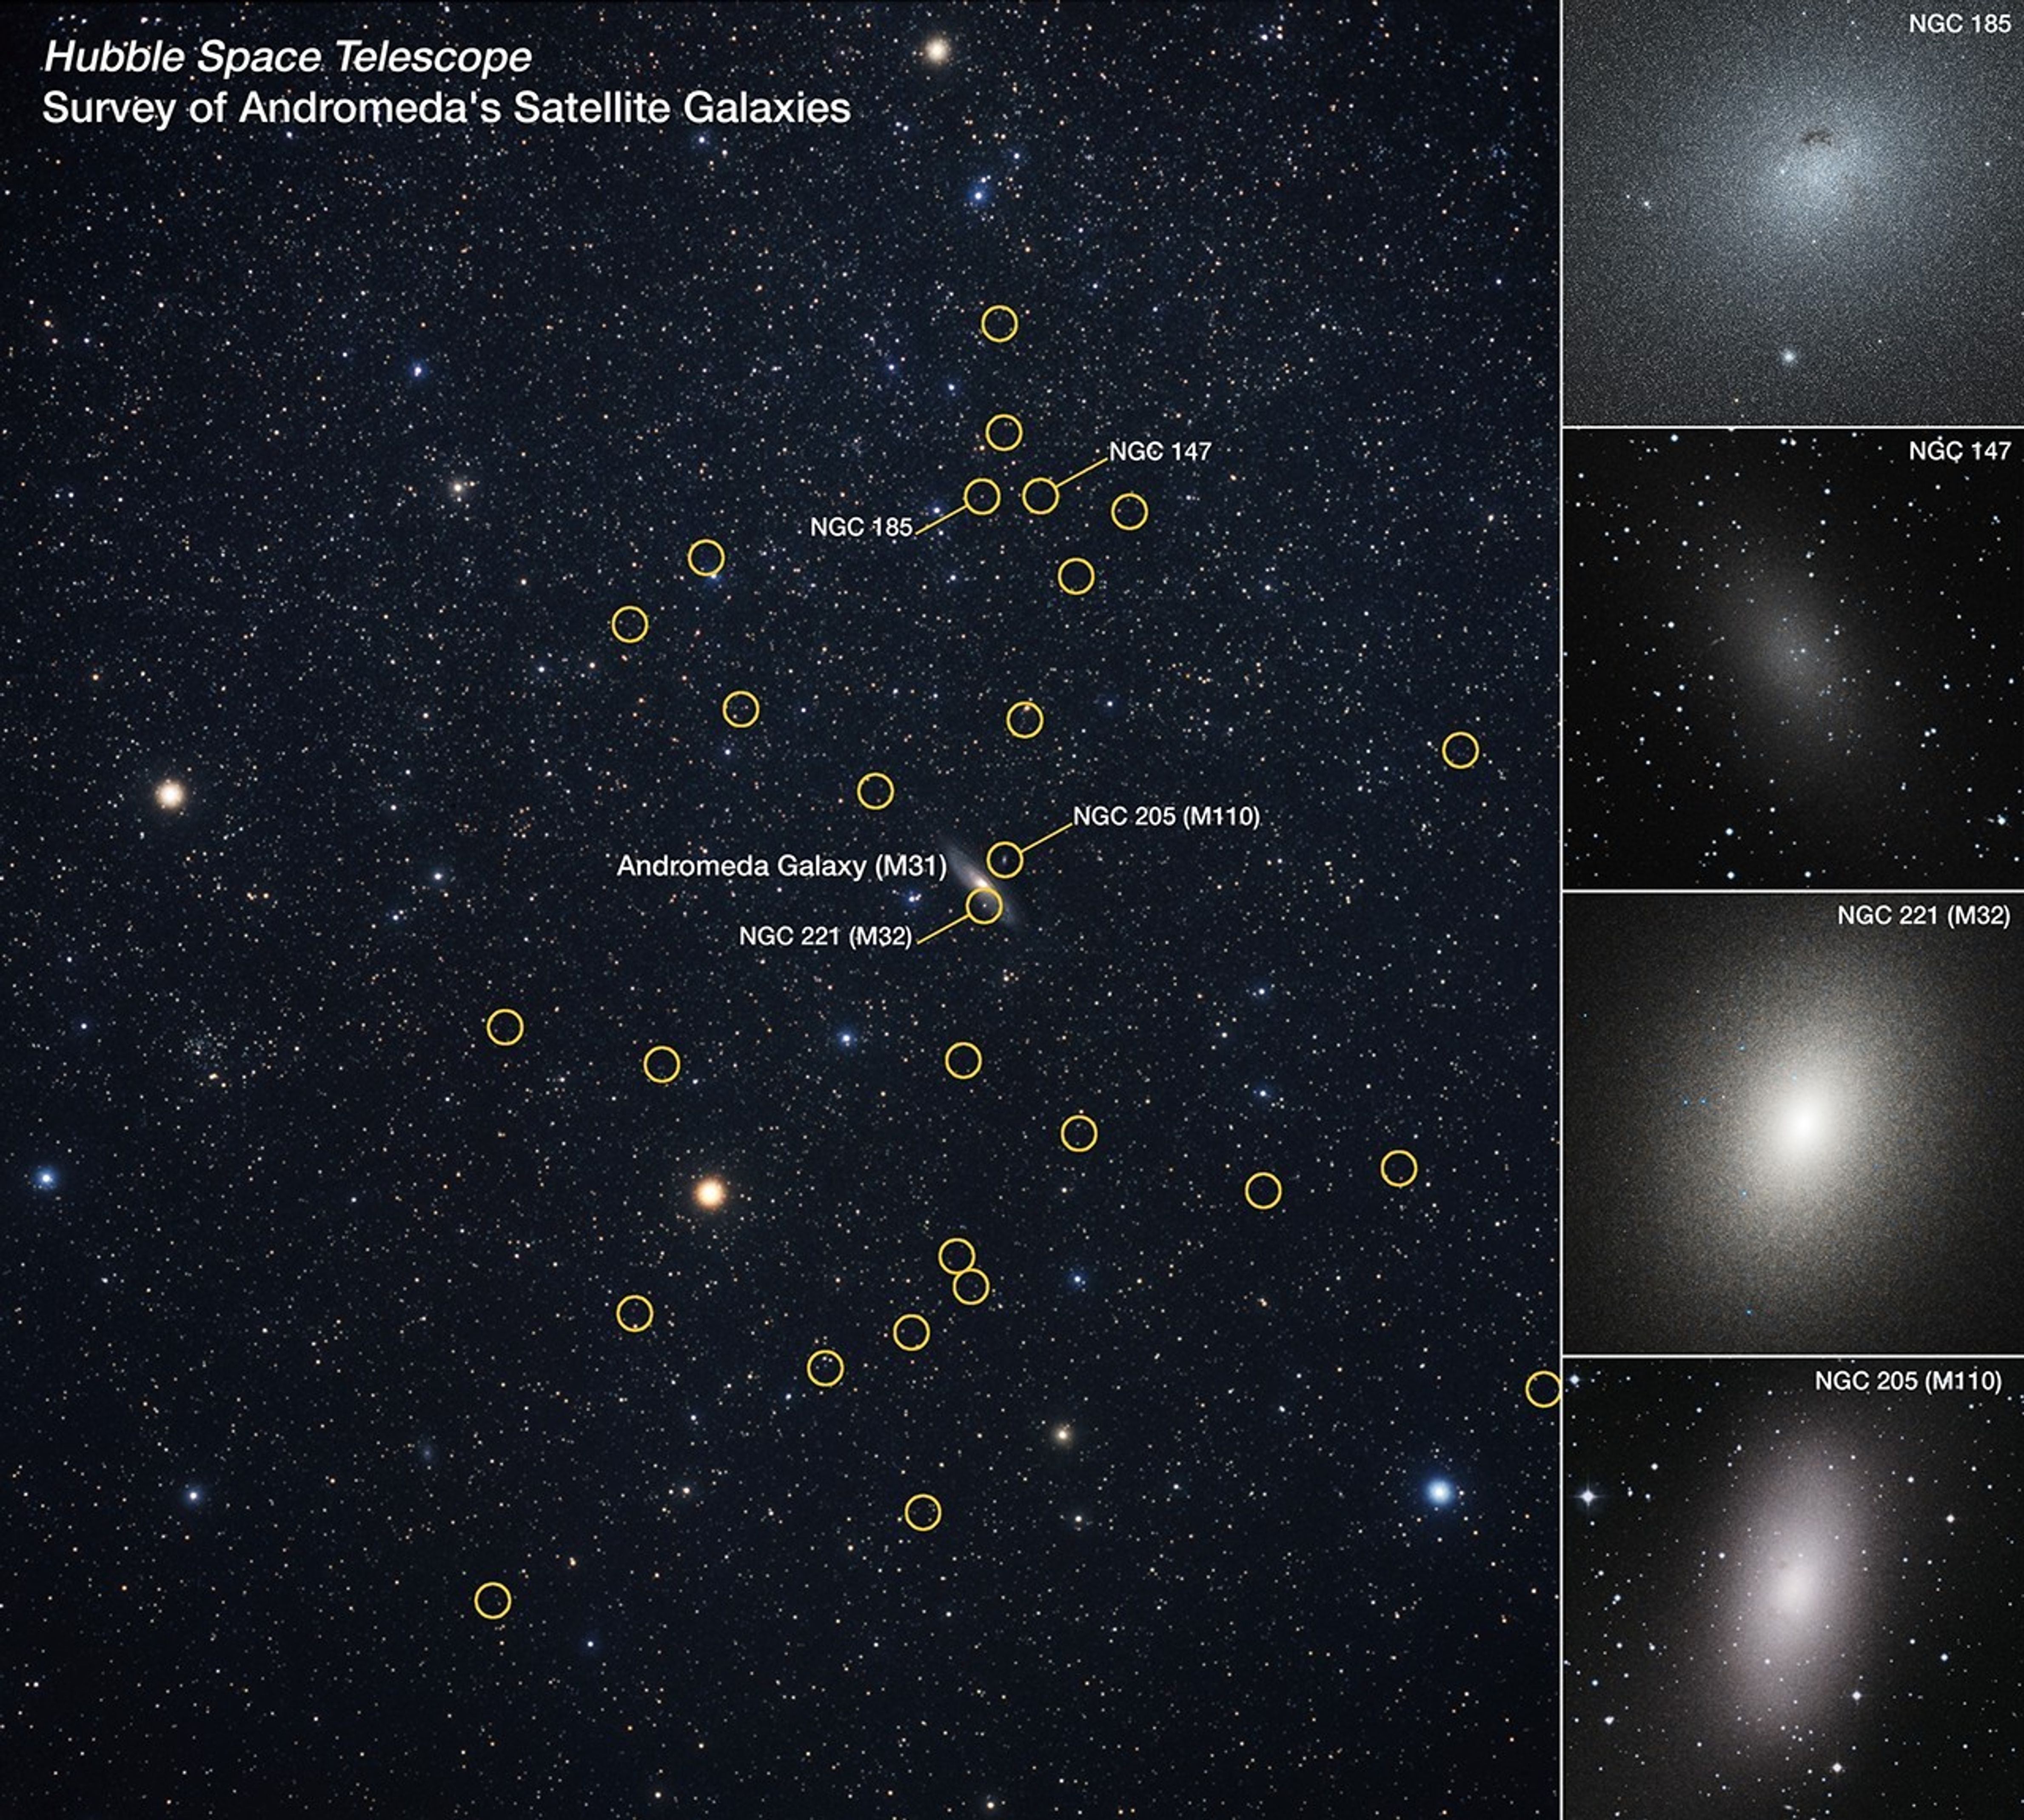
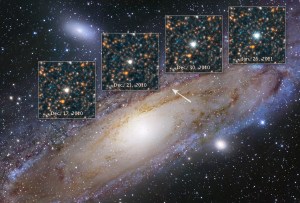
A view of the distribution of known satellite galaxies orbiting the large Andromeda galaxy (M31), located 2.5 million light-years away.
Credits: NASA, ESA, Alessandro Savino (UC Berkeley), Joseph DePasquale (STScI), Akira Fujii DSS2
Located 2.5 million light-years away, the majestic Andromeda galaxy appears to the naked eye as a faint, spindle-shaped object roughly the angular size of the full Moon. What backyard observers don’t see is a swarm of nearly three dozen small satellite galaxies circling the Andromeda galaxy, like bees around a hive.
These satellite galaxies represent a rambunctious galactic “ecosystem” that NASA’s Hubble Space Telescope is studying in unprecedented detail. This ambitious Hubble Treasury Program used observations from more than a whopping 1,000 Hubble orbits. Hubble’s optical stability, clarity, and efficiency made this ambitious survey possible. This work included building a precise 3D mapping of all the dwarf galaxies buzzing around Andromeda and reconstructing how efficiently they formed new stars over the nearly 14 billion years of the universe’s lifetime.
This is a wide-angle view of the distribution of known satellite galaxies orbiting the large Andromeda galaxy (M31), located 2.5 million light-years away. The Hubble Space Telescope was used to study the entire population of 36 mini-galaxies circled in yellow. Andromeda is the bright spindle-shaped object at image center. All the dwarf galaxies seem to be confined to a plane, all orbiting in the same direction. The wide view is from ground-based photography. Hubble’s optical stability, clarity, and efficiency made this ambitious survey possible. Hubble close up snapshots of four dwarf galaxies are on image right. The most prominent dwarf galaxy is M32 (NGC 221), a compact ellipsoidal galaxy that might be the remnant core of a larger galaxy that collided with Andromeda a few billion years ago.
NASA, ESA, Alessandro Savino (UC Berkeley), Joseph DePasquale (STScI), Akira Fujii DSS2
In the study published in The Astrophysical Journal, Hubble reveals a markedly different ecosystem from the smaller number of satellite galaxies that circle our Milky Way. This offers forensic clues as to how our Milky Way galaxy and Andromeda have evolved differently over billions of years. Our Milky Way has been relatively placid. But it looks like Andromeda has had a more dynamic history, which was probably affected by a major merger with another big galaxy a few billion years ago. This encounter, and the fact that Andromeda is as much as twice as massive as our Milky Way, could explain its plentiful and diverse dwarf galaxy population.
Surveying the Milky Way’s entire satellite system in such a comprehensive way is very challenging because we are embedded inside our galaxy. Nor can it be accomplished for other large galaxies because they are too far away to study the small satellite galaxies in much detail. The nearest galaxy of comparable mass to the Milky Way beyond Andromeda is M81, at nearly 12 million light-years.
This bird’s-eye view of Andromeda’s satellite system allows us to decipher what drives the evolution of these small galaxies. “We see that the duration for which the satellites can continue forming new stars really depends on how massive they are and on how close they are to the Andromeda galaxy,” said lead author Alessandro Savino of the University of California at Berkeley. “It is a clear indication of how small-galaxy growth is disturbed by the influence of a massive galaxy like Andromeda.”
“Everything scattered in the Andromeda system is very asymmetric and perturbed. It does appear that something significant happened not too long ago,” said principal investigator Daniel Weisz of the University of California at Berkeley. “There’s always a tendency to use what we understand in our own galaxy to extrapolate more generally to the other galaxies in the universe. There’s always been concerns about whether what we are learning in the Milky Way applies more broadly to other galaxies. Or is there more diversity among external galaxies? Do they have similar properties? Our work has shown that low-mass galaxies in other ecosystems have followed different evolutionary paths than what we know from the Milky Way satellite galaxies.”
For example, half of the Andromeda satellite galaxies all seem to be confined to a plane, all orbiting in the same direction. “That’s weird. It was actually a total surprise to find the satellites in that configuration and we still don’t fully understand why they appear that way,” said Weisz.
This animation begins with a view of the neighboring Andromeda galaxy. We zoom through a scattering of foreground stars and enter the inky blackness of intergalactic space. We cross 2.5 million light-years to reach the Andromeda system, consisting of 36 dwarf satellite galaxies orbiting the giant spindle-shaped Andromeda galaxy at image center. An ambitious survey by the Hubble Space Telescope was made to plot the galaxy locations in three-dimensional space. In this video we circle around a model of the Andromeda system based on real Hubble observational data.
NASA, ESA, Christian Nieves (STScI), Alessandro Savino (UC Berkeley); Acknowledgment: Joseph DePasquale (STScI), Frank Summers (STScI), Robert Gendler
The brightest companion galaxy to Andromeda is Messier 32 (M32). This is a compact ellipsoidal galaxy that might just be the remnant core of a larger galaxy that collided with Andromeda a few billion years ago. After being gravitationally stripped of gas and some stars, it continued along its orbit. Galaxy M32 contains older stars, but there is evidence it had a flurry of star formation a few billion years ago. In addition to M32, there seems to be a unique population of dwarf galaxies in Andromeda not seen in the Milky Way. They formed most of their stars very early on, but then they didn’t stop. They kept forming stars out of a reservoir of gas at a very low rate for a much longer time.
“Star formation really continued to much later times, which is not at all what you would expect for these dwarf galaxies,” continued Savino. “This doesn’t appear in computer simulations. No one knows what to make of that so far.”
“We do find that there is a lot of diversity that needs to be explained in the Andromeda satellite system,” added Weisz. “The way things come together matters a lot in understanding this galaxy’s history.”
Hubble is providing the first set of imaging where astronomers measure the motions of the dwarf galaxies. In another five years Hubble or NASA’s James Webb Space Telescope will be able to get the second set of observations, allowing astronomers to do a dynamical reconstruction for all 36 of the dwarf galaxies, which will help astronomers to rewind the motions of the entire Andromeda ecosystem billions of years into the past.
The Hubble Space Telescope has been operating for over three decades and continues to make ground-breaking discoveries that shape our fundamental understanding of the universe. Hubble is a project of international cooperation between NASA and ESA (European Space Agency). NASA’s Goddard Space Flight Center in Greenbelt, Maryland, manages the telescope and mission operations. Lockheed Martin Space, based in Denver, also supports mission operations at Goddard. The Space Telescope Science Institute in Baltimore, which is operated by the Association of Universities for Research in Astronomy, conducts Hubble science operations for NASA.
Preparations for Next Moonwalk Simulations Underway (and Underwater)
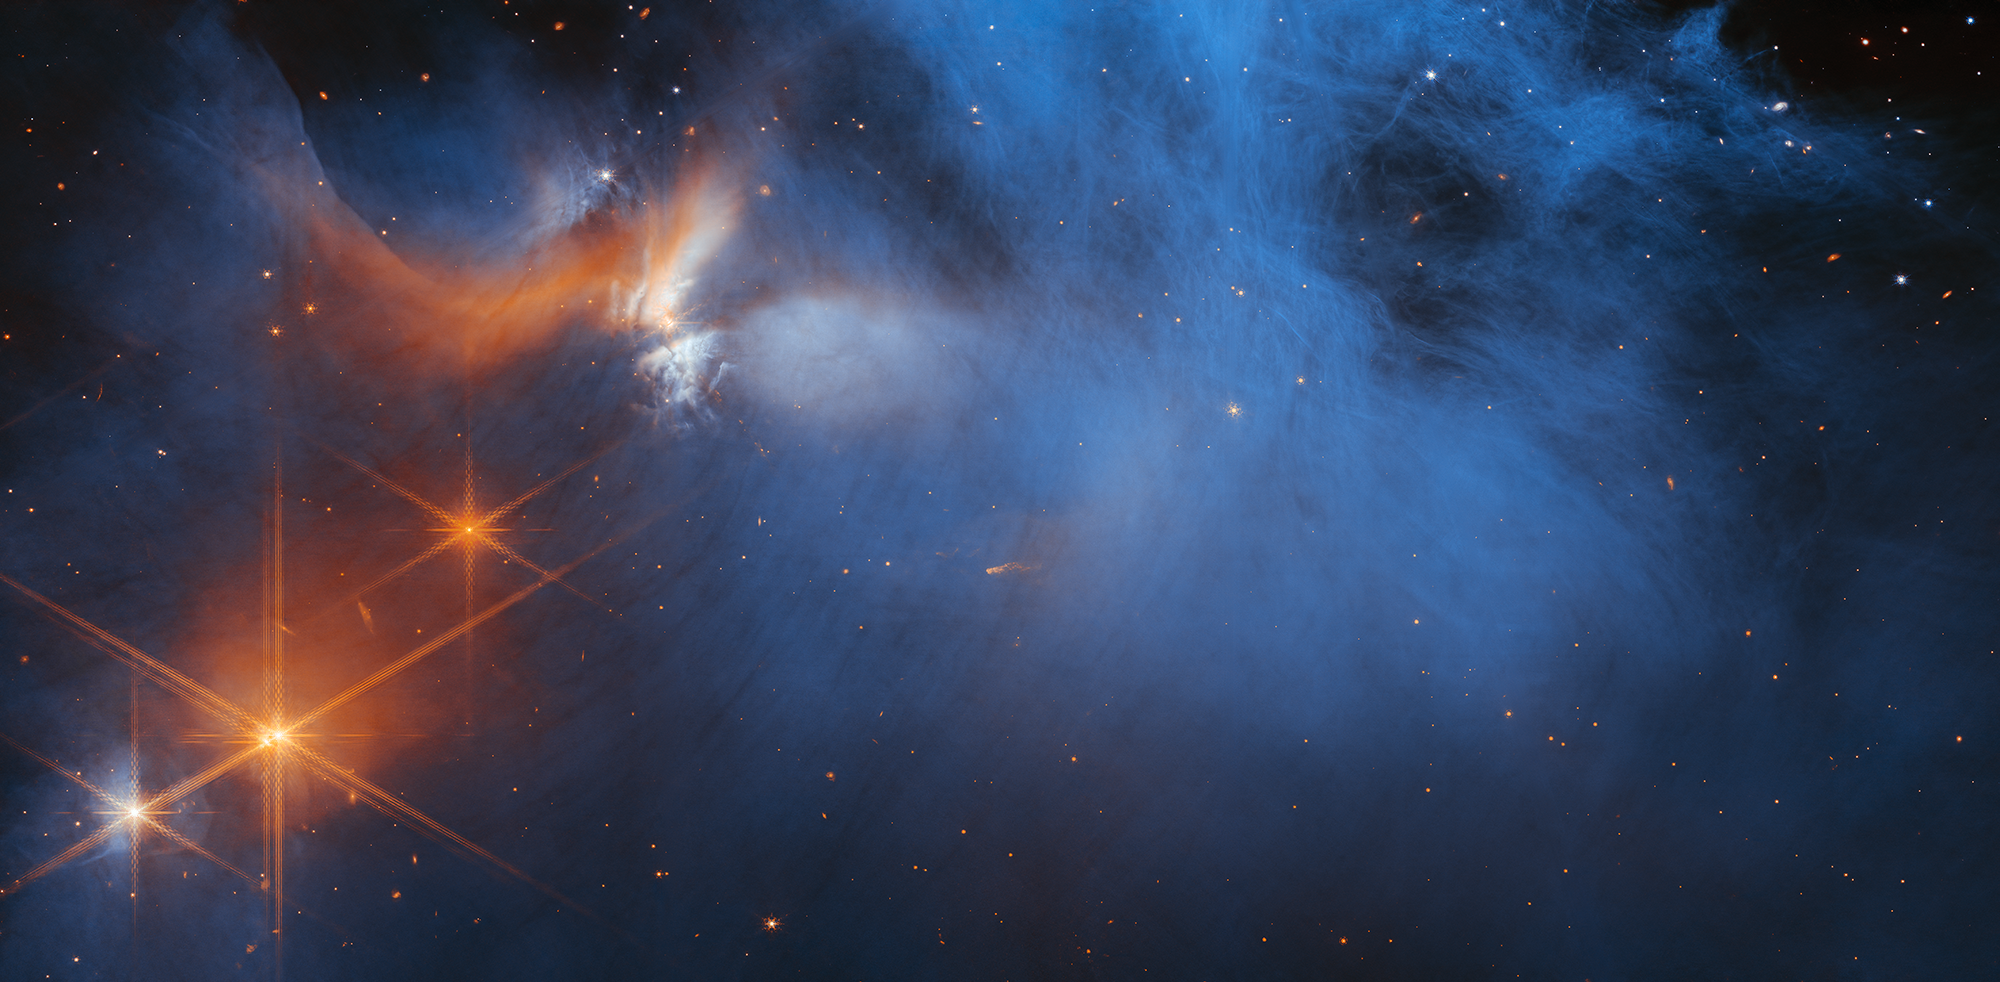
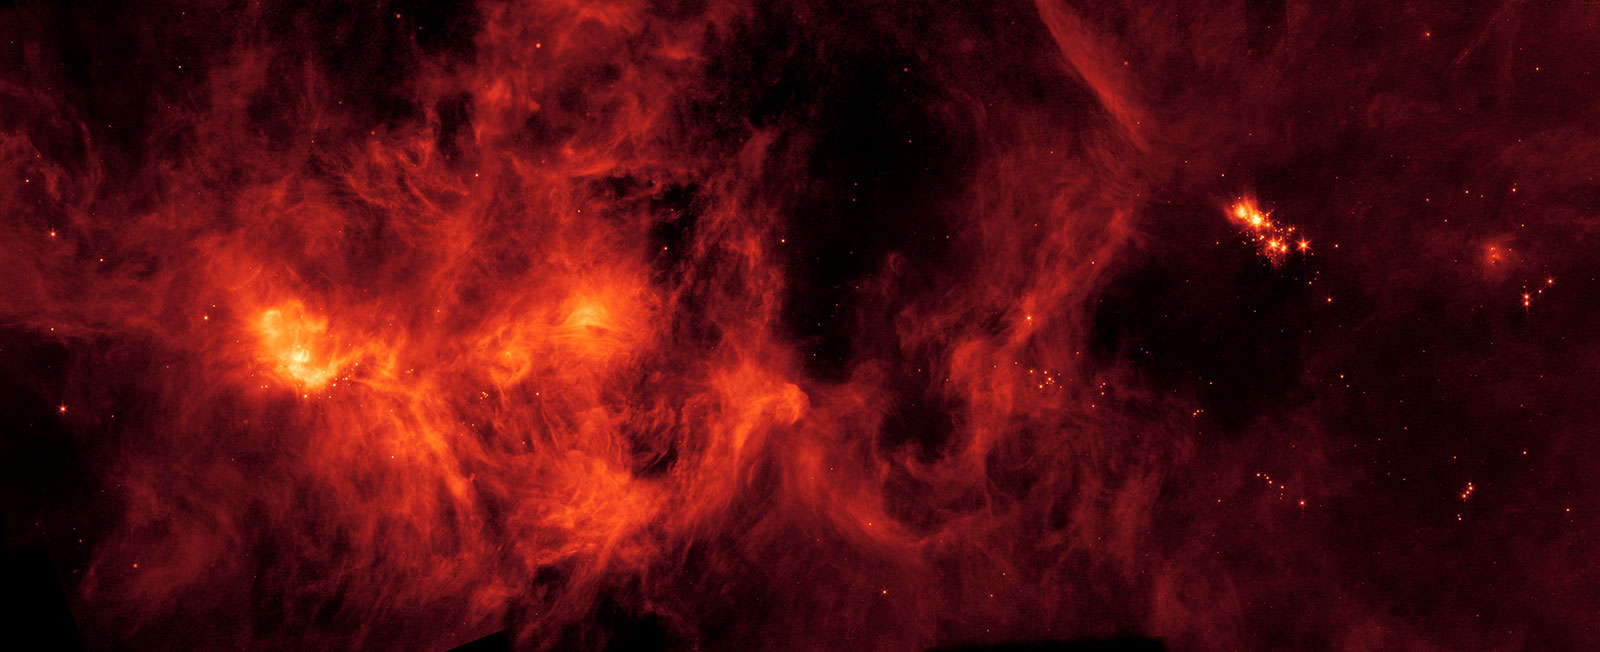
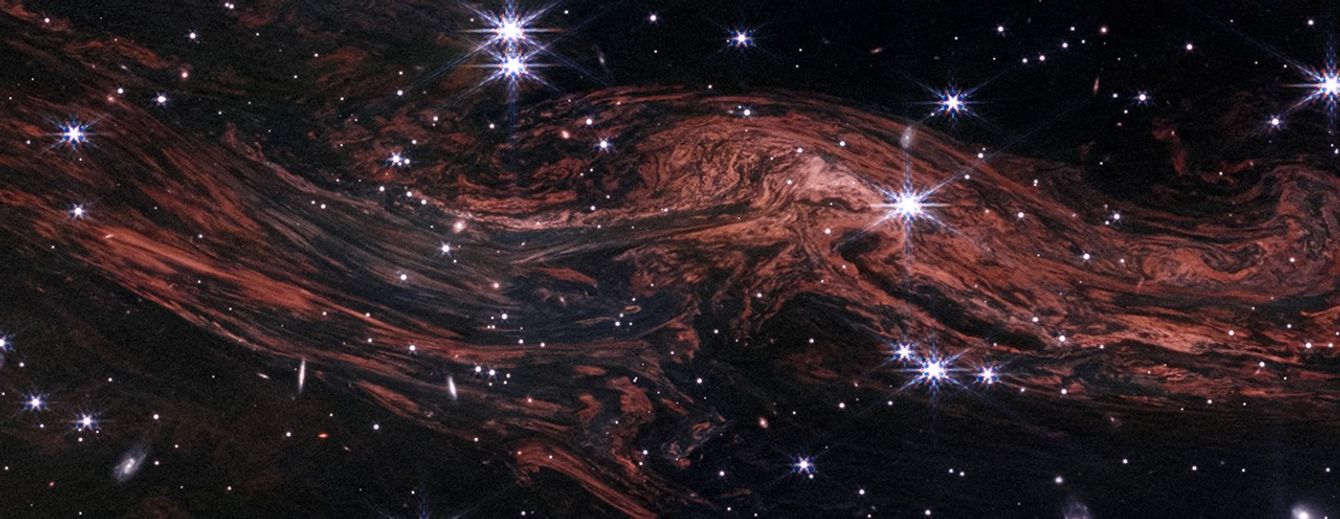
NASA’s SPHEREx mission will survey the Milky Way galaxy looking for water ice and other key ingredients for life. In the search for these frozen compounds, the mission will focus on molecular clouds — collections of gas and dust in space — like this one imaged by the agency’s James Webb Space Telescope.
NASA, ESA, CSA
Where is all the water that may form oceans on distant planets and moons? The SPHEREx astrophysics mission will search the galaxy and take stock.
Every living organism on Earth needs water to survive, so scientists searching for life outside our solar system, are often guided by the phrase “follow the water.” Scheduled to launch no earlier than Thursday, Feb. 27, NASA’s SPHEREx (Spectro-Photometer for the History of the Universe, Epoch of Reionization, and Ices Explorer) mission will help in that quest.
After its ride aboard a SpaceX Falcon 9 from Vandenberg Space Force base in California, the observatory will search for water, carbon dioxide, carbon monoxide, and other key ingredients for life frozen on the surface of interstellar dust grains in the clouds of gas and dust where planets and stars eventually form.
While there are no oceans or lakes floating freely in space, scientists think these reservoirs of ice, bound to small dust grains, are where most of the water in our universe forms and resides. Additionally, the water in Earth’s oceans as well as those of other planets and moons in our galaxy likely originated in such locations.
The Perseus Molecular Cloud, located about 1,000 light-years from Earth, was imaged by NASA’s retired Spitzer Space Telescope. NASA’s SPHEREx mission will search the galaxy for water ice and other frozen compounds in clouds of gas and dust in space like this one.
NASA/JPL-Caltech
The mission will focus on massive regions of gas and dust called molecular clouds. Within those, SPHEREx will also look at some newly formed stars and the disks of material around them from which new planets are born.
Although space telescopes such as NASA’s James Webb and retired Spitzer have detected water, carbon dioxide, carbon monoxide, and other compounds in hundreds of targets, the SPHEREx observatory is the first to be uniquely equipped to conduct a large-scale survey of the galaxy in search of water ice and other frozen compounds.
Rather than taking 2D images of a target like a star, SPHEREx will gather 3D data along its line of sight. That enables scientists to see the amount of ice present in a molecular cloud and observe how the composition of the ices throughout the cloud changes in different environments.
By making more than 9 million of these line-of-sight observations and creating the largest-ever survey of these materials, the mission will help scientists better understand how these compounds form on dust grains and how different environments can influence their abundance.
Tip of the Iceberg
It makes sense that the composition of planets and stars would reflect the molecular clouds they formed in. However, researchers are still working to confirm the specifics of the planet formation process, and the universe doesn’t always match scientists’ expectations.
For example, a NASA mission launched in 1998, the Submillimeter Wave Astronomy Satellite (SWAS), surveyed the galaxy for water in gas form — including in molecular clouds — but found far less than expected.
BAE Systems employees work on NASA’s SPHEREx observatory in the Astrotech Space Operations facility at Vandenberg Space Force Base in California on Jan. 16. Targeting a Feb. 27 launch, the mission will map the entire sky in infrared light.
NASA/JPL-Caltech
“This puzzled us for a while,” said Gary Melnick, a senior astronomer at the Center for Astrophysics | Harvard & Smithsonian and a member of the SPHEREx science team. “We eventually realized that SWAS had detected gaseous water in thin layers near the surface of molecular clouds, suggesting that there might be a lot more water inside the clouds, locked up as ice.”
The mission team’s hypothesis also made sense because SWAS detected less oxygen gas (two oxygen atoms bound together) than expected. They concluded that the oxygen atoms were sticking to interstellar dust grains, and were then joined by hydrogen atoms, forming water. Later research confirmed this. What’s more, the clouds shield molecules from cosmic radiation that would otherwise break those compounds apart. As a result, water ice and other materials stored deep in a cloud’s interior are protected.
As starlight passes through a molecular cloud, molecules like water and carbon dioxide block certain wavelengths of light, creating a distinct signature that SPHEREx and other missions like Webb can identify using a technique called absorption spectroscopy.
In addition to providing a more detailed accounting of the abundance of these frozen compounds, SPHEREx will help researchers answer questions including how deep into molecular clouds ice begins to form, how the abundance of water and other ices changes with the density of a molecular cloud, and how that abundance changes once a star forms.
Powerful Partnerships
As a survey telescope, SPHEREx is designed to study large portions of the sky relatively quickly, and its results can be used in conjunction with data from targeted telescopes like Webb, which observe a significantly smaller area but can see their targets in greater detail.
“If SPHEREx discovers a particularly intriguing location, Webb can study that target with higher spectral resolving power and in wavelengths that SPHEREx cannot detect,” said Melnick. “These two telescopes could form a highly effective partnership.”
More About SPHEREx
SPHEREx is managed by NASA’s Jet Propulsion Laboratory in Southern California for the Astrophysics Division within the Science Mission Directorate at NASA Headquarters in Washington. BAE Systems (formerly Ball Aerospace) built the telescope and the spacecraft bus. The science analysis of the SPHEREx data will be conducted by a team of scientists located at 10 institutions in the U.S., two in South Korea, and one in Taiwan. Data will be processed and archived at IPAC at Caltech, which manages JPL for NASA. The mission principal investigator is based at Caltech with a joint JPL appointment. The SPHEREx dataset will be publicly available at the NASA/IPAC Infrared Science Archive.
For more information about the SPHEREx mission visit:
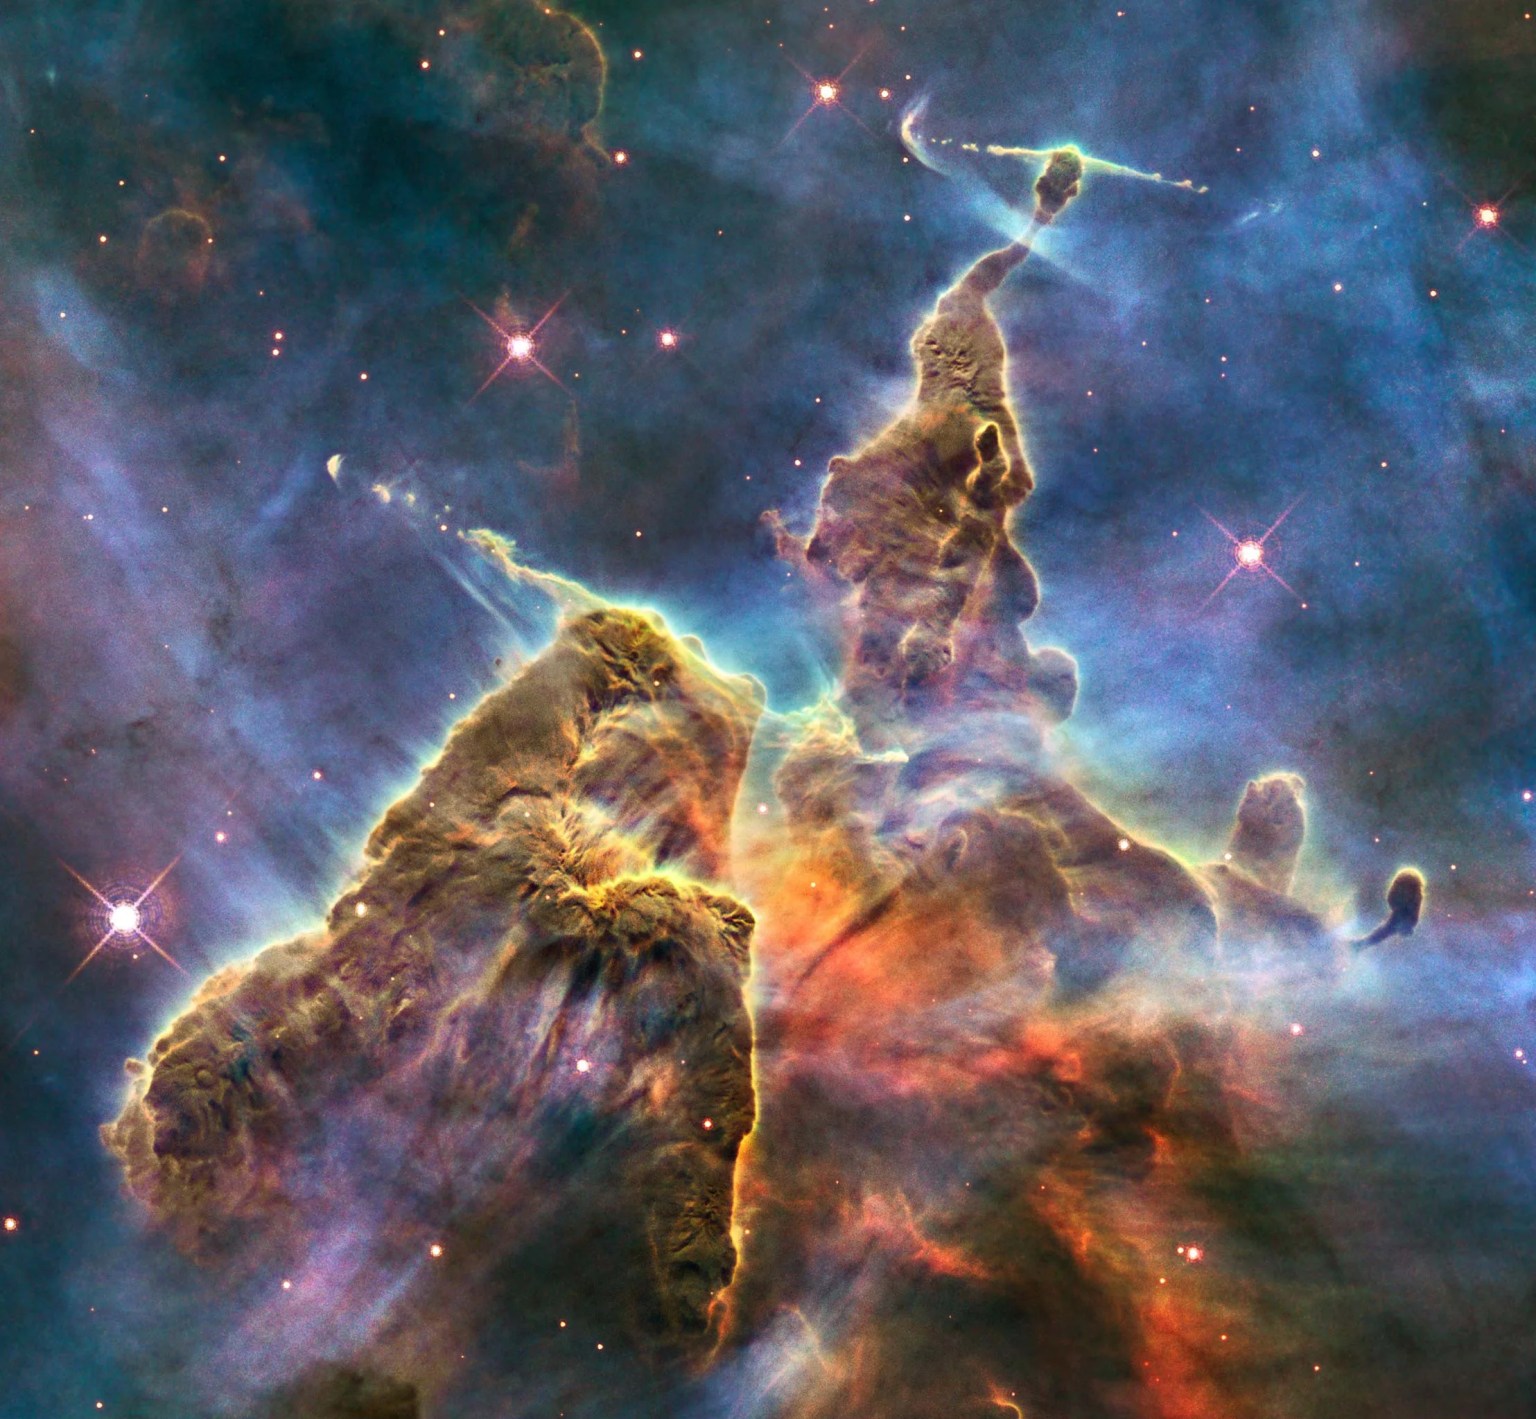
X-ray: NASA/CXC/Penn State Univ./L. Townsley et al.; Infrared: NASA/JPL-CalTech/SST; Optical: NASA/STScI/HST; Radio: ESO/NAOJ/NRAO/ALMA; Image Processing: NASA/CXC/SAO/J. Schmidt, N. Wolk, K. Arcand
A bouquet of thousands of stars in bloom has arrived. This composite image contains the deepest X-ray image ever made of the spectacular star forming region called 30 Doradus.
By combining X-ray data from NASA’s Chandra X-ray Observatory (blue and green) with optical data from NASA’s Hubble Space Telescope (yellow) and radio data from the Atacama Large Millimeter/submillimeter Array (orange), this stellar arrangement comes alive.
X-ray: NASA/CXC/Penn State Univ./L. Townsley et al.; Infrared: NASA/JPL-CalTech/SST; Optical: NASA/STScI/HST; Radio: ESO/NAOJ/NRAO/ALMA; Image Processing: NASA/CXC/SAO/J. Schmidt, N. Wolk, K. Arcand
Otherwise known as the Tarantula Nebula, 30 Dor is located about 160,000 light-years away in a small neighboring galaxy to the Milky Way known as the Large Magellanic Cloud (LMC). Because it one of the brightest and populated star-forming regions to Earth, 30 Dor is a frequent target for scientists trying to learn more about how stars are born.
With enough fuel to have powered the manufacturing of stars for at least 25 million years, 30 Dor is the most powerful stellar nursery in the local group of galaxies that includes the Milky Way, the LMC, and the Andromeda galaxy.
The massive young stars in 30 Dor send cosmically strong winds out into space. Along with the matter and energy ejected by stars that have previously exploded, these winds have carved out an eye-catching display of arcs, pillars, and bubbles.
A dense cluster in the center of 30 Dor contains the most massive stars astronomers have ever found, each only about one to two million years old. (Our Sun is over a thousand times older with an age of about 5 billion years.)
This new image includes the data from a large Chandra program that involved about 23 days of observing time, greatly exceeding the 1.3 days of observing that Chandra previously conducted on 30 Dor. The 3,615 X-ray sources detected by Chandra include a mixture of massive stars, double-star systems, bright stars that are still in the process of forming, and much smaller clusters of young stars.
There is a large quantity of diffuse, hot gas seen in X-rays, arising from different sources including the winds of massive stars and from the gas expelled by supernova explosions. This data set will be the best available for the foreseeable future for studying diffuse X-ray emission in star-forming regions.
The long observing time devoted to this cluster allows astronomers the ability to search for changes in the 30 Dor’s massive stars. Several of these stars are members of double star systems and their movements can be traced by the changes in X-ray brightness.
A paper describing these results appears in the July 2024 issue of The Astrophysical Journal Supplement Series. NASA’s Marshall Space Flight Center manages the Chandra program. The Smithsonian Astrophysical Observatory’s Chandra X-ray Center controls science operations from Cambridge, Massachusetts, and flight operations from Burlington, Massachusetts.
This release features a highly detailed composite image of a star-forming region of space known as 30 Doradus, shaped like a bouquet, or a maple leaf.
30 Doradus is a powerful stellar nursery. In 23 days of observation, the Chandra X-ray telescope revealed thousands of distinct star systems. Chandra data also revealed a diffuse X-ray glow from winds blowing off giant stars, and X-ray gas expelled by exploding stars, or supernovas.
In this image, the X-ray wind and gas takes the shape of a massive purple and pink bouquet with an extended central flower, or perhaps a leaf from a maple tree. The hazy, mottled shape occupies much of the image, positioned just to our left of center, tilted slightly to our left. Inside the purple and pink gas and wind cloud are red and orange veins, and pockets of bright white light. The pockets of white light represent clusters of young stars. One cluster at the heart of 30 Doradus houses the most massive stars astronomers have ever found.
The hazy purple and pink bouquet is surrounded by glowing dots of green, white, orange, and red. A second mottled purple cloud shape, which resembles a ring of smoke, sits in our lower righthand corner.
This artist’s concept visualizes a super-Neptune world orbiting a low-mass star near the center of our Milky Way galaxy. Scientists recently discovered such a system that may break the current record for fastest exoplanet system, traveling at least 1.2 million miles per hour, or 540 kilometers per second.
NASA/JPL-Caltech/R. Hurt (Caltech-IPAC)
Astronomers may have discovered a scrawny star bolting through the middle of our galaxy with a planet in tow. If confirmed, the pair sets a new record for the fastest-moving exoplanet system, nearly double our solar system’s speed through the Milky Way.
The planetary system is thought to move at least 1.2 million miles per hour, or 540 kilometers per second.
“We think this is a so-called super-Neptune world orbiting a low-mass star at a distance that would lie between the orbits of Venus and Earth if it were in our solar system,” said Sean Terry, a postdoctoral researcher at the University of Maryland, College Park and NASA’s Goddard Space Flight Center in Greenbelt, Maryland. Since the star is so feeble, that’s well outside its habitable zone. “If so, it will be the first planet ever found orbiting a hypervelocity star.”
The pair of objects was first spotted indirectly in 2011 thanks to a chance alignment. A team of scientists combed through archived data from MOA (Microlensing Observations in Astrophysics) – a collaborative project focused on a microlensing survey conducted using the University of Canterbury Mount John Observatory in New Zealand — in search of light signals that betray the presence of exoplanets, or planets outside our solar system.
Microlensing occurs because the presence of mass warps the fabric of space-time. Any time an intervening object appears to drift near a background star, light from the star curves as it travels through the warped space-time around the nearer object. If the alignment is especially close, the warping around the object can act like a natural lens, amplifying the background star’s light.
This artist’s concept visualizes stars near the center of our Milky Way galaxy. Each has a colorful trail indicating its speed –– the longer and redder the trail, the faster the star is moving. NASA scientists recently discovered a candidate for a particularly speedy star, visualized near the center of this image, with an orbiting planet. If confirmed, the pair sets a record for fastest known exoplanet system.
NASA/JPL-Caltech/R. Hurt (Caltech-IPAC)
In this case, microlensing signals revealed a pair of celestial bodies. Scientists determined their relative masses (one is about 2,300 times heavier than the other), but their exact masses depend on how far away they are from Earth. It’s sort of like how the magnification changes if you hold a magnifying glass over a page and move it up and down.
“Determining the mass ratio is easy,” said David Bennett, a senior research scientist at the University of Maryland, College Park and NASA Goddard, who co-authored the new paper and led the original study in 2011. “It’s much more difficult to calculate their actual masses.”
The 2011 discovery team suspected the microlensed objects were either a star about 20 percent as massive as our Sun and a planet roughly 29 times heavier than Earth, or a nearer “rogue” planet about four times Jupiter’s mass with a moon smaller than Earth.
To figure out which explanation is more likely, astronomers searched through data from the Keck Observatory in Hawaii and ESA’s (European Space Agency’s) Gaia satellite. If the pair were a rogue planet and moon, they’d be effectively invisible – dark objects lost in the inky void of space. But scientists might be able to identify the star if the alternative explanation were correct (though the orbiting planet would be much too faint to see).
They found a strong suspect located about 24,000 light-years away, putting it within the Milky Way’s galactic bulge — the central hub where stars are more densely packed. By comparing the star’s location in 2011 and 2021, the team calculated its high speed.
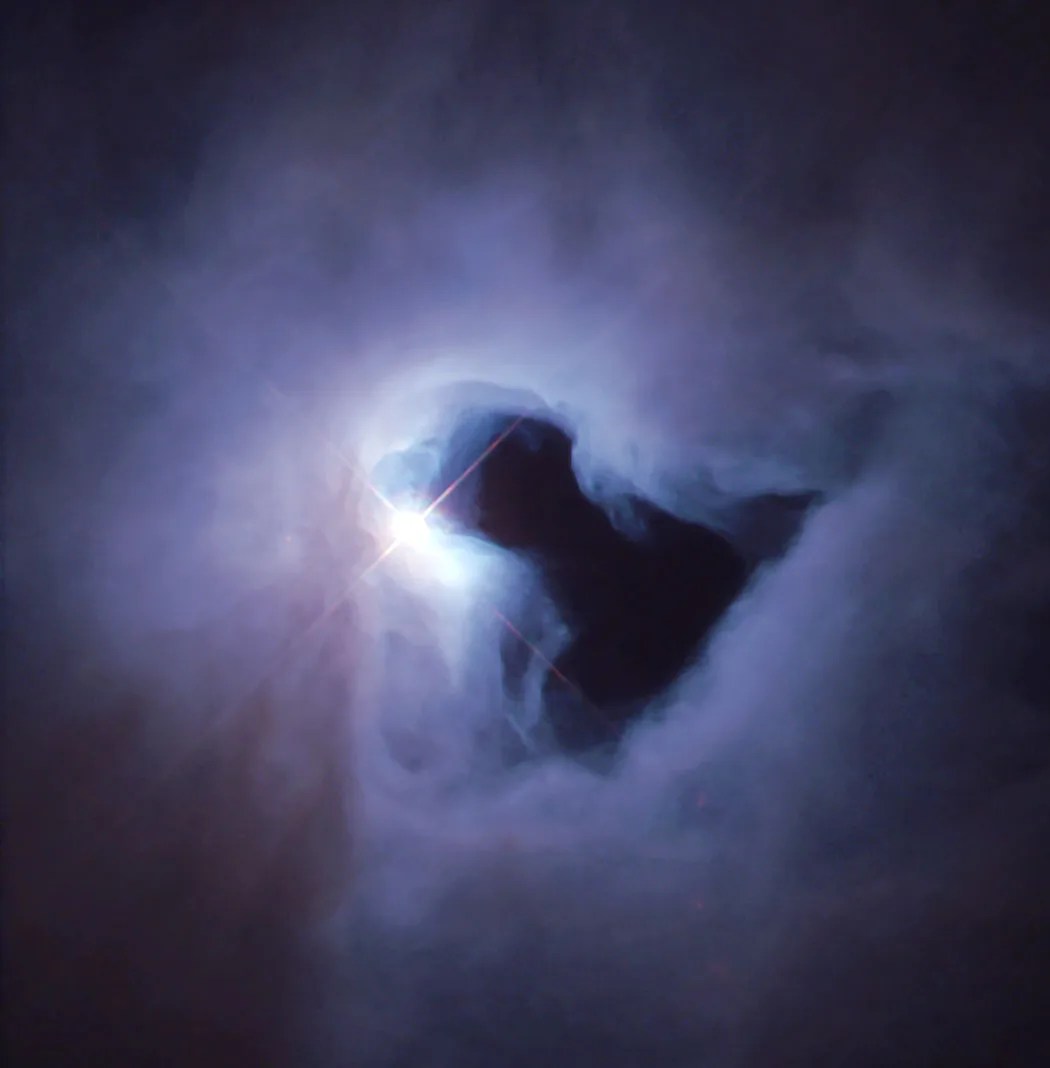
This Hubble Space Telescope image shows a bow shock around a very young star called LL Ori. Named for the crescent-shaped wave made by a ship as it moves through water, a bow shock can be created in space when two streams of gas collide. Scientists think a similar feature may be present around a newfound star that could be traveling at least 1.2 million miles per hour, or 540 kilometers per second. Traveling at such a high velocity in the galactic bulge (the central part of the galaxy) where gas is denser could generate a bow shock.
NASA and The Hubble Heritage Team (STScI/AURA); Acknowledgment: C. R. O’Dell (Vanderbilt University)
But that’s just its 2D motion; if it’s also moving toward or away from us, it must be moving even faster. Its true speed may even be high enough to exceed the galaxy’s escape velocity of just over 1.3 million miles per hour, or about 600 kilometers per second. If so, the planetary system is destined to traverse intergalactic space many millions of years in the future.
“To be certain the newly identified star is part of the system that caused the 2011 signal, we’d like to look again in another year and see if it moves the right amount and in the right direction to confirm it came from the point where we detected the signal,” Bennett said.
“If high-resolution observations show that the star just stays in the same position, then we can tell for sure that it is not part of the system that caused the signal,” said Aparna Bhattacharya, a research scientist at the University of Maryland, College Park and NASA Goddard who co-authored the new paper. “That would mean the rogue planet and exomoon model is favored.”
NASA’s upcoming Nancy Grace Roman Space Telescope will help us find out how common planets are around such speedy stars, and may offer clues to how these systems are accelerated. The mission will conduct a survey of the galactic bulge, pairing a large view of space with crisp resolution.
“In this case we used MOA for its broad field of view and then followed up with Keck and Gaia for their sharper resolution, but thanks to Roman’s powerful view and planned survey strategy, we won’t need to rely on additional telescopes,” Terry said. “Roman will do it all.”
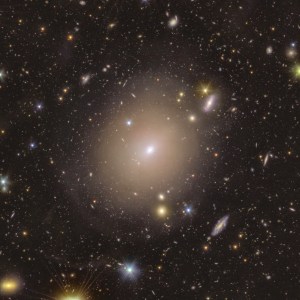
The ring of light surrounding the center of the galaxy NGC 6505, captured by ESA’s Euclid telescope, is an example of an Einstein ring. NGC 6505 is acting as a gravitational lens, bending light from a galaxy far behind it.
ESA/Euclid/Euclid Consortium/NASA, image processing by J.-C. Cuillandre, G. Anselmi, T. Li; CC BY-SA 3.0 IGO or ESA Standard Licence
Euclid, an ESA (European Space Agency) mission with NASA contributions, has made a surprising discovery in our cosmic backyard: a phenomenon called an Einstein ring.
An Einstein ring is light from a distant galaxy bending to form a ring that appears aligned with a foreground object. The name honors Albert Einstein, whose general theory of relativity predicts that light will bend and brighten around objects in space.
In this way, particularly massive objects like galaxies and galaxy clusters serve as cosmic magnifying glasses, bringing even more distant objects into view. Scientists call this gravitational lensing.
Euclid Archive Scientist Bruno Altieri noticed a hint of an Einstein ring among images from the spacecraft’s early testing phase in September 2023.
“Even from that first observation, I could see it, but after Euclid made more observations of the area, we could see a perfect Einstein ring,” Altieri said. “For me, with a lifelong interest in gravitational lensing, that was amazing.”
The ring appears to encircle the center of a well-studied elliptical galaxy called NGC 6505, which is around 590 million light-years from Earth in the constellation Draco. That may sound far, but on the scale of the entire universe, NGC 6505 is close by. Thanks to Euclid’s high-resolution instruments, this is the first time that the ring of light surrounding the galaxy has been detected.
Light from a much more distant bright galaxy, some 4.42 billion light-years away, creates the ring in the image. Gravity distorted this light as it traveled toward us. This faraway galaxy hasn’t been observed before and doesn’t yet have a name.
“An Einstein ring is an example of strong gravitational lensing,” explained Conor O’Riordan, of the Max Planck Institute for Astrophysics, Germany, and lead author of the first scientific paper analyzing the ring. A strong gravitational lens produces multiple images of a background source that may appear as arcs, forming a ring like this, for example. “All strong lenses are special, because they’re so rare, and they’re incredibly useful scientifically. This one is particularly special, because it’s so close to Earth and the alignment makes it very beautiful.”
Einstein rings are a rich laboratory for scientists to explore many mysteries of the universe. For example, an invisible form of matter called dark matter contributes to the bending of light into a ring, so this is an indirect way to study dark matter. Einstein rings are also relevant to the expansion of the universe because the space between us and these galaxies — both in the foreground and the background — is stretching. Scientists can also learn about the background galaxy itself.
“I find it very intriguing that this ring was observed within a well-known galaxy, which was first discovered in 1884,” said Valeria Pettorino, ESA Euclid project scientist. “The galaxy has been known to astronomers for a very long time. And yet this ring was never observed before. This demonstrates how powerful Euclid is, finding new things even in places we thought we knew well. This discovery is very encouraging for the future of the Euclid mission and demonstrates its fantastic capabilities.”
A close-up view of the center of the NGC 6505 galaxy, with the bright Einstein ring aligned with it, captured by ESA’s Euclid space telescope.
ESA/Euclid/Euclid Consortium/NASA, image processing by J.-C. Cuillandre, G. Anselmi, T. Li; CC BY-SA 3.0 IGO or ESA Standard Licence
By exploring how the universe has expanded and formed over its cosmic history, Euclid will reveal more about the role of gravity and the nature of dark energy and dark matter. Dark energy is the mysterious force that appears to be causing the universe’s expansion. The space telescope will map more than a third of the sky, observing billions of galaxies out to 10 billion light-years. It is expected to find around 100,000 strong gravitational lenses.
“Euclid is going to revolutionize the field with all this data we’ve never had before,” added O’Riordan.
Although finding this Einstein ring is an achievement, Euclid must look for a different, less visually obvious type of gravitational lensing called “weak lensing” to help fulfil its quest of understanding dark energy. In weak lensing, background galaxies appear only mildly stretched or displaced. To detect this effect, scientists will need to analyze billions of galaxies.
Euclid launched from Cape Canaveral, Florida, July 1, 2023, and began its detailed survey of the sky Feb. 14, 2024. The mission is gradually creating the most extensive 3D map of the universe yet. The Einstein ring find so early in its mission indicates Euclid is on course to uncover many more secrets of the universe.
More About Euclid
Euclid is a European mission, built and operated by ESA, with contributions from NASA. The Euclid Consortium — consisting of more than 2,000 scientists from 300 institutes in 15 European countries, the United States, Canada, and Japan — is responsible for providing the scientific instruments and scientific data analysis. ESA selected Thales Alenia Space as prime contractor for the construction of the satellite and its service module, with Airbus Defence and Space chosen to develop the payload module, including the telescope. Euclid is a medium-class mission in ESA’s Cosmic Vision Programme.
Three NASA-supported science teams contribute to the Euclid mission. In addition to designing and fabricating the sensor-chip electronics for Euclid’s Near Infrared Spectrometer and Photometer (NISP) instrument, NASA’s Jet Propulsion Laboratory led the procurement and delivery of the NISP detectors as well. Those detectors, along with the sensor chip electronics, were tested at NASA’s Detector Characterization Lab at Goddard Space Flight Center in Greenbelt, Maryland. The Euclid NASA Science Center at IPAC (ENSCI), at Caltech in Pasadena, California, will archive the science data and support U.S.-based science investigations. JPL is a division of Caltech.
Media Contacts
Elizabeth Landau Headquarters, Washington 202-358-0845 elandau@nasa.gov
Alexandra Bell is bringing more than a decade of experience in nuclear policy to the Bulletin of the Atomic Scientists, the organization that sets the Doomsday Clock.
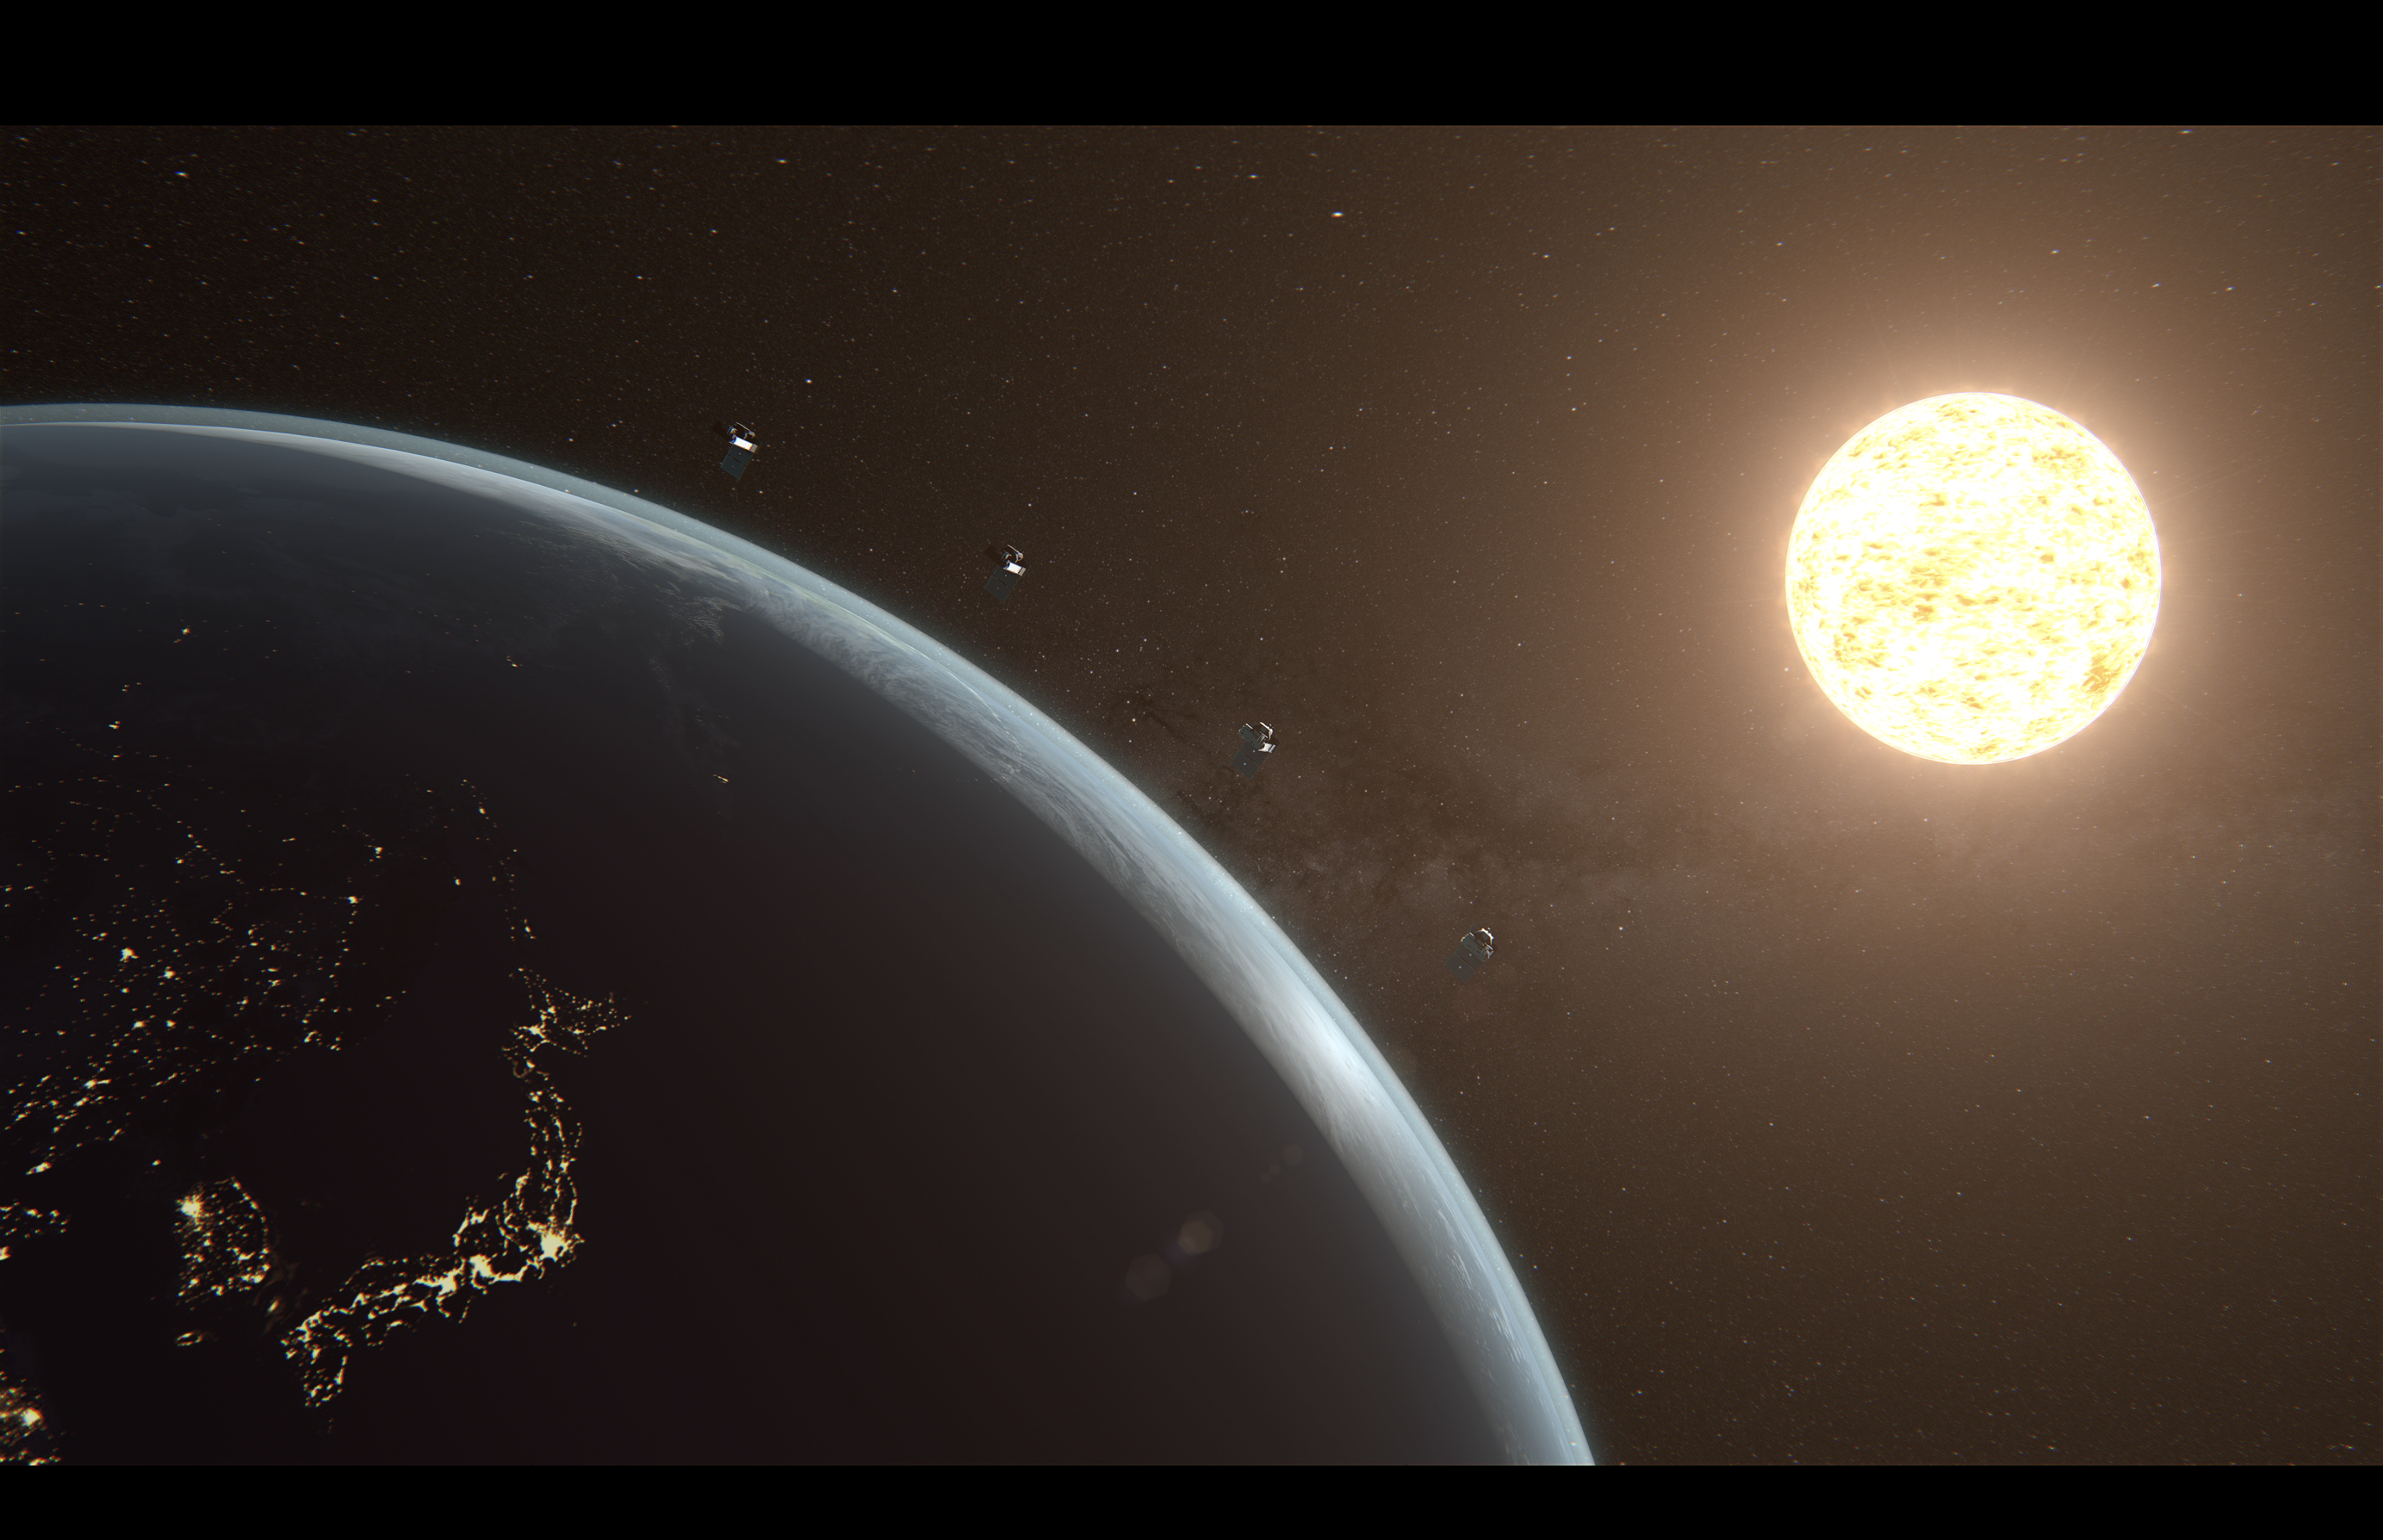
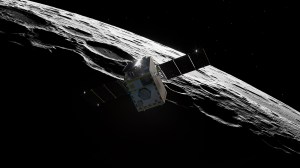
Caption: Illustration of the four PUNCH spacecraft in low Earth orbit. Credit: NASA’s Goddard Space Flight Center Conceptual Image Lab
NASA will hold a media teleconference at 2 p.m. EST on Tuesday, Feb. 4, to share information about the agency’s upcoming PUNCH (Polarimeter to Unify the Corona and Heliosphere) mission, which is targeted to launch no earlier than Thursday, Feb. 27.
The agency’s PUNCH mission is a constellation of four small satellites. When they arrive in low Earth orbit, the satellites will make global, 3D observations of the Sun’s outer atmosphere, the corona, and help NASA learn how the mass and energy there become solar wind. By imaging the Sun’s corona and the solar wind together, scientists hope to better understand the entire inner heliosphere – Sun, solar wind, and Earth – as a single connected system.
Audio of the teleconference will stream live on the agency’s website at:
Madhulika Guhathakurta, NASA program scientist, NASA Headquarters
Nicholeen Viall, PUNCH mission scientist, NASA’s Goddard Space Flight Center
Craig DeForest, PUNCH principal investigator, Southwest Research Institute
To participate in the media teleconference, media must RSVP no later than 12 p.m. on Feb. 4 to: Abbey Interrante at: abbey.a.interrante@nasa.gov. NASA’s media accreditation policy is available online.
The PUNCH mission will share a ride to space with NASA’s SPHEREx (Spectro-Photometer for the History of the Universe, Epoch of Reionization and Ices Explorer) space telescope on a SpaceX Falcon 9 rocket from Space Launch Complex 4 East at Vandenberg Space Force Base in California.
The Southwest Research Institute in Boulder, Colorado, leads the PUNCH mission. The mission is managed by the Explorers Program Office at NASA’s Goddard Space Flight Center in Greenbelt, Maryland, for NASA’s Science Mission Directorate in Washington.
Astronomers have taken a crucial step in showing that the most massive black holes in the universe can create their own meals. Data from NASA’s Chandra X-ray Observatory and the Very Large Telescope (VLT) provide new evidence that outbursts from black holes can help cool down gas to feed themselves.
This study was based on observations of seven clusters of galaxies. The centers of galaxy clusters contain the universe’s most massive galaxies, which harbor huge black holes with masses ranging from millions to tens of billions of times that of the Sun. Jets from these black holes are driven by the black holes feasting on gas.
These images show two of the galaxy clusters in the study, the Perseus Cluster and the Centaurus Cluster. Chandra data represented in blue reveals X-rays from filaments of hot gas, and data from the VLT, an optical telescope in Chile, shows cooler filaments in red.
The results support a model where outbursts from the black holes trigger hot gas to cool and form narrow filaments of warm gas. Turbulence in the gas also plays an important role in this triggering process.
According to this model, some of the warm gas in these filaments should then flow into the centers of the galaxies to feed the black holes, causing an outburst. The outburst causes more gas to cool and feed the black holes, leading to further outbursts.
This model predicts there will be a relationship between the brightness of filaments of hot and warm gas in the centers of galaxy clusters. More specifically, in regions where the hot gas is brighter, the warm gas should also be brighter. The team of astronomers has, for the first time, discovered such a relationship, giving critical support for the model.
This result also provides new understanding of these gas-filled filaments, which are important not just for feeding black holes but also for causing new stars to form. This advance was made possible by an innovative technique that isolates the hot filaments in the Chandra X-ray data from other structures, including large cavities in the hot gas created by the black hole’s jets.
The newly found relationship for these filaments shows remarkable similarity to the one found in the tails of jellyfish galaxies, which have had gas stripped away from them as they travel through surrounding gas, forming long tails. This similarity reveals an unexpected cosmic connection between the two objects and implies a similar process is occurring in these objects.
This work was led by Valeria Olivares from the University of Santiago de Chile, and was published Monday in Nature Astronomy. The study brought together international experts in optical and X-ray observations and simulations from the United States, Chile, Australia, Canada, and Italy. The work relied on the capabilities of the MUSE (Multi Unit Spectroscopic Explorer) instrument on the VLT, which generates 3D views of the universe.
NASA’s Marshall Space Flight Center in Huntsville, Alabama, manages the Chandra program. The Smithsonian Astrophysical Observatory’s Chandra X-ray Center controls science operations from Cambridge, Massachusetts, and flight operations from Burlington, Massachusetts.
This release features composite images shown side-by-side of two different galaxy clusters, each with a central black hole surrounded by patches and filaments of gas. The galaxy clusters, known as Perseus and Centaurus, are two of seven galaxy clusters observed as part of an international study led by the University of Santiago de Chile.
In each image, a patch of purple with neon pink veins floats in the blackness of space, surrounded by flecks of light. At the center of each patch is a glowing, bright white dot. The bright white dots are black holes. The purple patches represent hot X-ray gas, and the neon pink veins represent filaments of warm gas. According to the model published in the study, jets from the black holes impact the hot X-ray gas. This gas cools into warm filaments, with some warm gas flowing back into the black hole. The return flow of warm gas causes jets to again cool the hot gas, triggering the cycle once again.
While the images of the two galaxy clusters are broadly similar, there are significant visual differences. In the image of the Perseus Cluster on the left, the surrounding flecks of light are larger and brighter, making the individual galaxies they represent easier to discern. Here, the purple gas has a blue tint, and the hot pink filaments appear solid, as if rendered with quivering strokes of a paintbrush. In the image of the Centaurus Cluster on the right, the purple gas appears softer, with a more diffuse quality. The filaments are rendered in more detail, with feathery edges, and gradation in color ranging from pale pink to neon red.
NASA’s NICER Continues Science Operations Post Repair
NASA crew aboard the International Space Station installed patches to the agency’s NICER (Neutron star Interior Composition Explorer) mission during a spacewalk on Jan. 16. NICER, an X-ray telescope perched near the station’s starboard solar array, resumed science operations later the same day.
The patches cover areas of NICER’s thermal shields where damage was discovered in May 2023. These thin filters block sunlight while allowing X-rays to pass through. After the discovery, the NICER team restricted their observations during the station’s daytime to avoid overwhelming the mission’s sensitive detectors. Nighttime observations were unaffected, and the team was able to continue collecting data for the science community to make groundbreaking measurements using the instrument’s full capabilities.
The repair went according to plan. Data since collected shows the detectors behind the patched areas are performing better than before during station night, and the overall level of sunlight inside NICER during the daytime is reduced substantially.
While NICER experiences less interference from sunlight than before, after analyzing initial data, the team has determined the telescope still experiences more interference than expected. The installed patches cover areas of known damage identified using astronomical observations and from photos taken by both external robotic cameras and astronauts inside the space station. Measurements collected since the repair and close-up, high-resolution photos obtained during the spacewalk are providing new information that may point the way toward further daytime data collection.
In the meantime, NICER continues operations with its full measurement capabilities during orbit night to enable further trailblazing discoveries in time domain and multimessenger astrophysics.
On Tuesday, May 22, NASA’s NICER (Neutron Star Interior Composition Explorer), an X-ray telescope on the International Space Station, developed a “light leak,” in which unwanted sunlight enters the instrument. While analyzing incoming data since then, the team identified an impact to daytime observations. Nighttime observations seem to be unaffected.
The team suspects that at least one of the thin thermal shields on NICER’s 56 X-ray Concentrators has been damaged, allowing sunlight to reach its sensitive detectors.
To mitigate the effects on measurements, the NICER team has limited daytime observations to objects far away from the Sun’s position in the sky. The team has also updated commands to NICER that automatically lower its sensitivity during the orbital day to reduce the effects from sunlight contamination. The team is evaluating these changes and assessing additional measures to reduce the impact on science observations.
To date, more than 300 scientific papers have used NICER observations, and the team is confident that NICER will continue to produce world-class science.
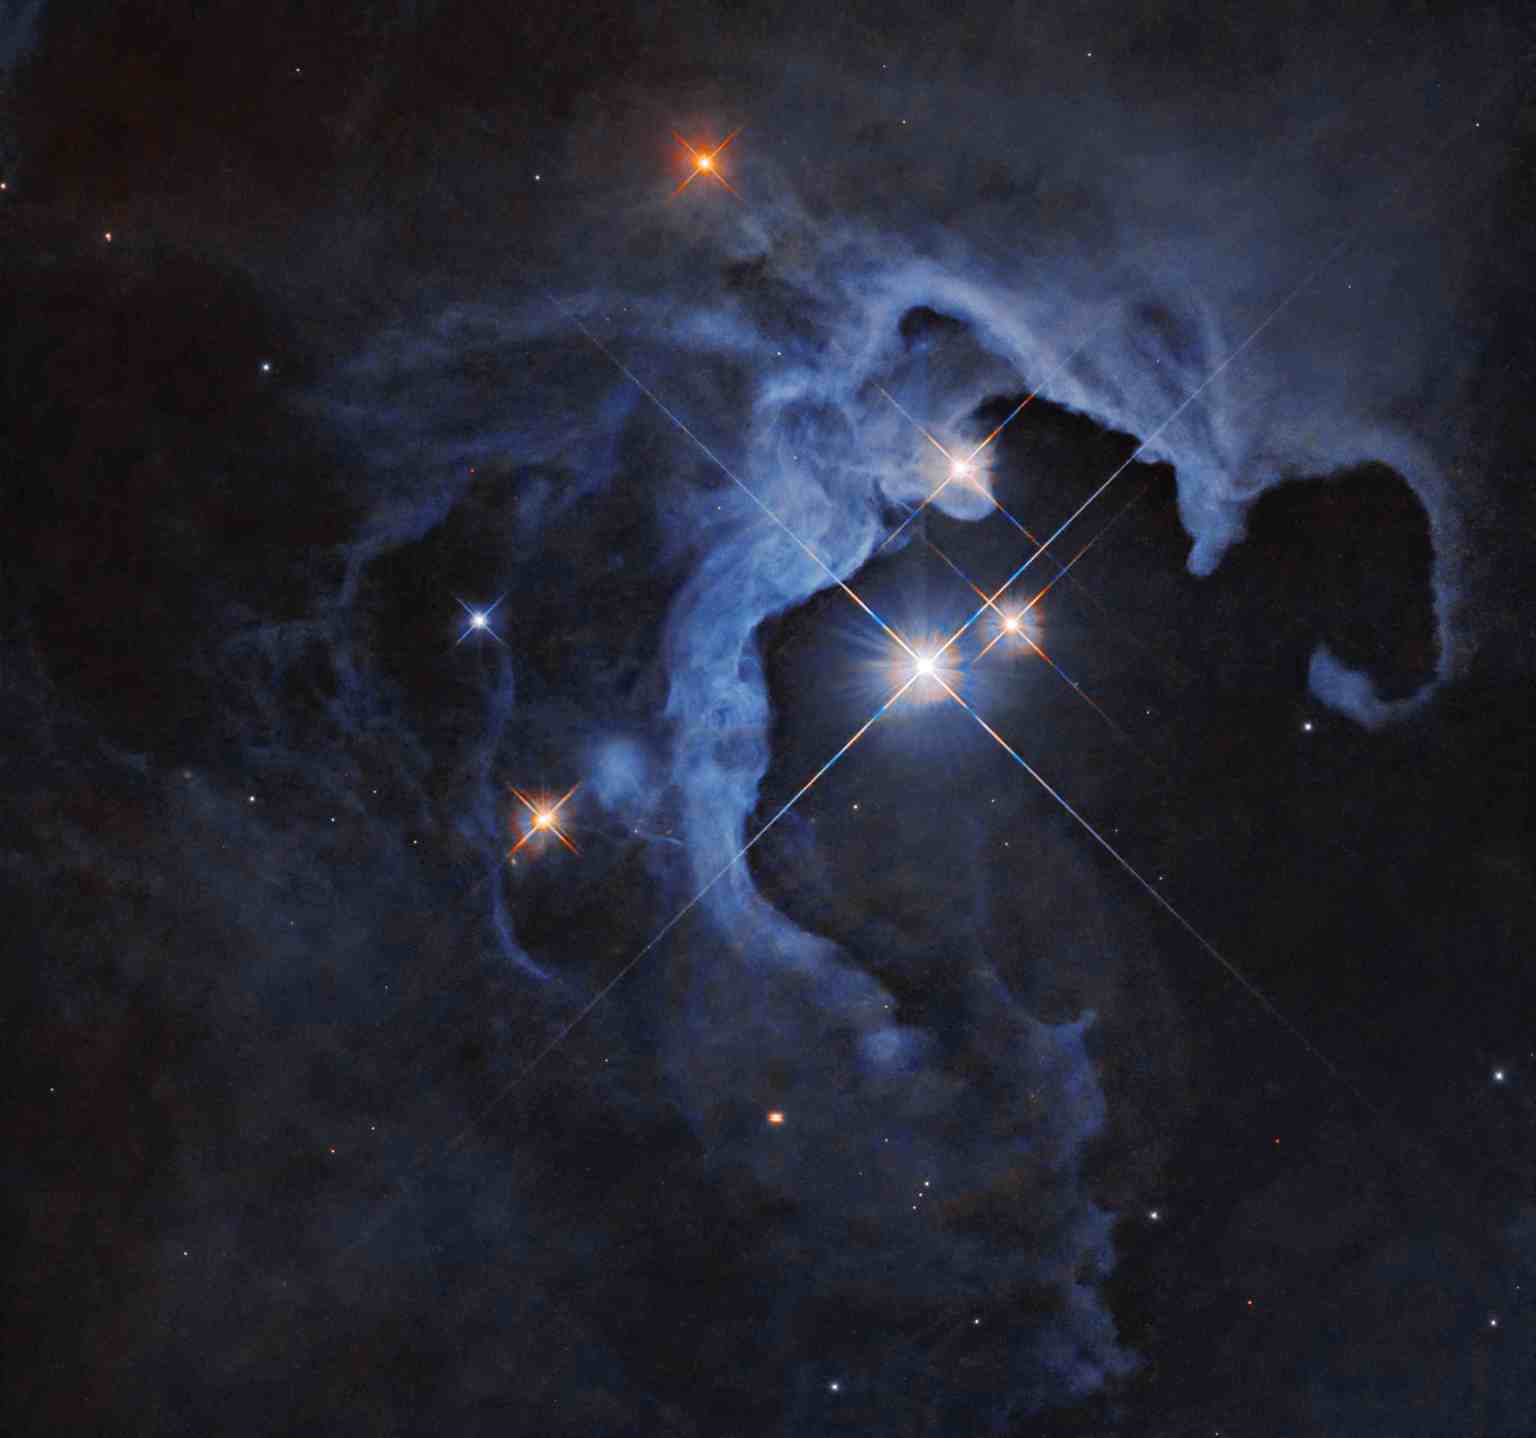
Hubble Captures Young Stars Changing Their Environments
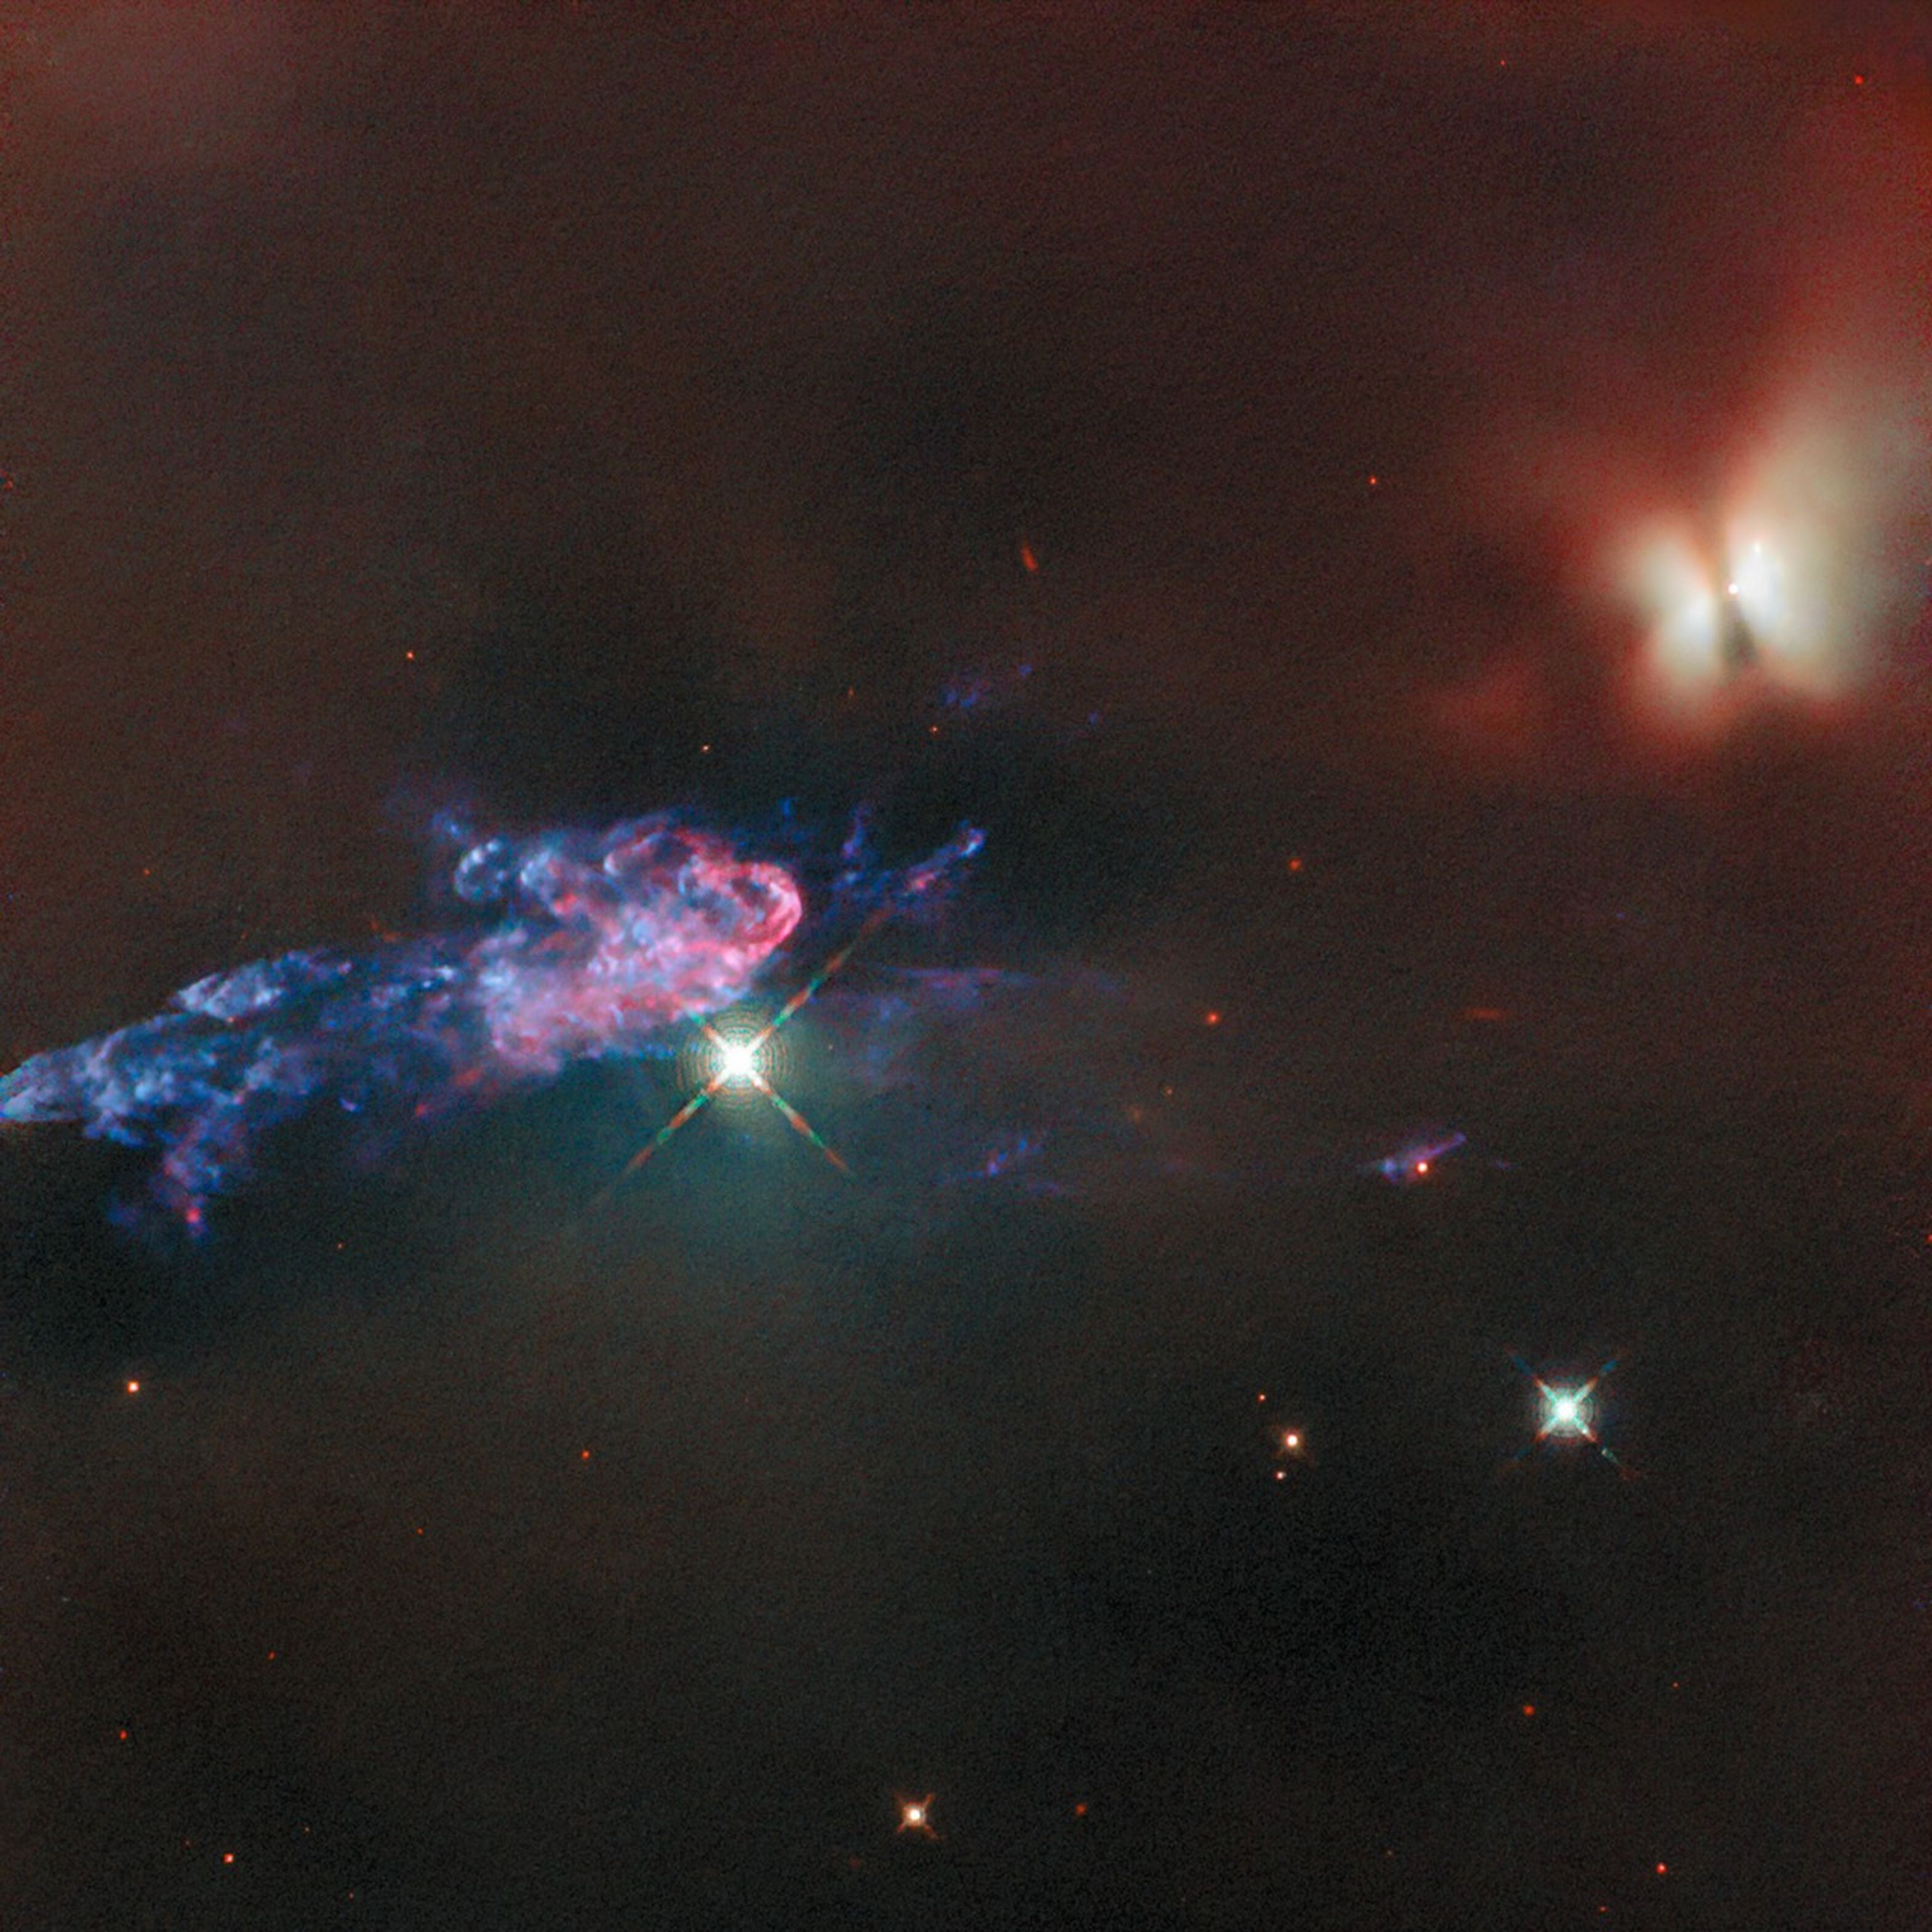
This NASA/ESA Hubble Space Telescope image features the nearest star-forming region to Earth, the Orion Nebula (Messier 42, M42), located some 1,500 light-years away.
ESA/Hubble, NASA, and T. Megeath
This NASA/ESA Hubble Space Telescope image peers into the dusty recesses of the nearest massive star-forming region to Earth, the Orion Nebula (Messier 42, M42). Just 1,500 light-years away, the Orion Nebula is visible to the unaided eye below the three stars that form the ‘belt’ in the constellation Orion. The nebula is home to hundreds of newborn stars including the subject of this image: the protostars HOPS 150 and HOPS 153.
These protostars get their names from the Herschel Orion Protostar Survey, conducted with ESA’s Herschel Space Observatory. The object visible in the upper-right corner of this image is HOPS 150: it’s a binary star system where two young protostars orbit each other. Each star has a small, dusty disk of material surrounding it. These stars gather material from their respective dust disks, growing in the process. The dark line that cuts across the bright glow of these protostars is a cloud of gas and dust falling in on the pair of protostars. It is over 2,000 times wider than the distance between Earth and the Sun. Based on the amount of infrared light HOPS 150 is emitting, as compared to other wavelengths it emits, the protostars are mid-way down the path to becoming mature stars.
Extending across the left side of the image is a narrow, colorful outflow called a jet. This jet comes from the nearby protostar HOPS 153, which is out of the frame. HOPS 153 is significantly younger than its neighbor. That stellar object is still deeply embedded in its birth nebula and enshrouded by a cloud of cold, dense gas. While Hubble cannot penetrate this gas to see the protostar, the jet HOPS 153 emitted is brightly and clearly visible as it plows into the surrounding gas and dust of the Orion Nebula.
The transition from tightly swaddled protostar to fully fledged star will dramatically affect HOPS 153’s surroundings. As gas falls onto the protostar, its jets spew material and energy into interstellar space, carving out bubbles and heating the gas. By stirring up and warming nearby gas, HOPS 153 may regulate the formation of new stars in its neighborhood and even slow its own growth.
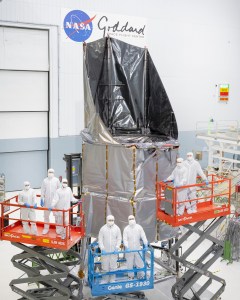
Pandora, NASA’s newest exoplanet mission, is one step closer to launch with the completion of the spacecraft bus, which provides the structure, power, and other systems that will enable the mission to carry out its work.
Watch to learn more about NASA’s Pandora mission, which will revolutionize the study of exoplanet atmospheres. NASA’s Goddard Space Flight Center
“This is a huge milestone for us and keeps us on track for a launch in the fall,” said Elisa Quintana, Pandora’s principal investigator at NASA’s Goddard Space Flight Center in Greenbelt, Maryland. “The bus holds our instruments and handles navigation, data acquisition, and communication with Earth — it’s the brains of the spacecraft.”
Pandora, a small satellite, will provide in-depth study of at least 20 known planets orbiting distant stars in order to determine the composition of their atmospheres — especially the presence of hazes, clouds, and water. This data will establish a firm foundation for interpreting measurements by NASA’s James Webb Space Telescope and future missions that will search for habitable worlds.
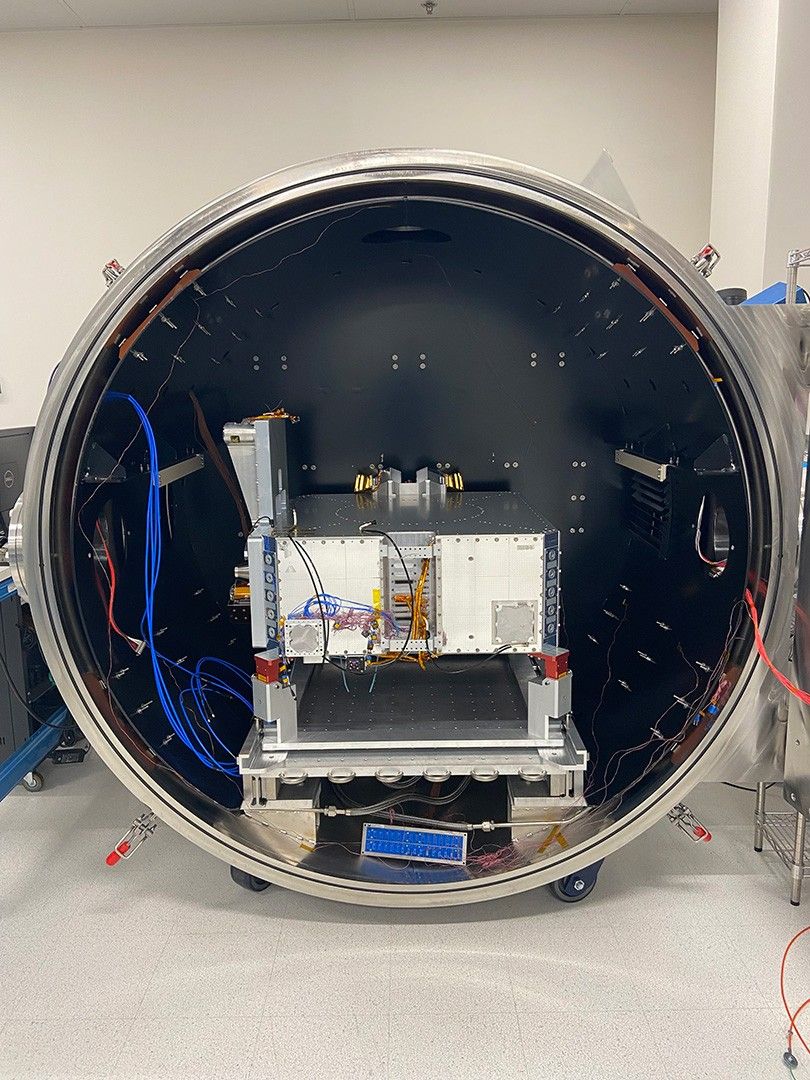
Pandora’s spacecraft bus was photographed Jan. 10 within a thermal-vacuum testing chamber at Blue Canyon Technologies in Lafayette, Colorado. The bus provides the structure, power, and other systems that will enable the mission to help astronomers better separate stellar features from the spectra of transiting planets.
NASA/Weston Maughan, BCT
“We see the presence of water as a critical aspect of habitability because water is essential to life as we know it,” said Goddard’s Ben Hord, a NASA Postdoctoral Program Fellow who discussed the mission at the 245th meeting of the American Astronomical Society in National Harbor, Maryland. “The problem with confirming its presence in exoplanet atmospheres is that variations in light from the host star can mask or mimic the signal of water. Separating these sources is where Pandora will shine.”
“Pandora’s near-infrared detector is actually a spare developed for the Webb telescope, which right now is the observatory most sensitive to exoplanet atmospheres,” Hord added. “In turn, our observations will improve Webb’s ability to separate the star’s signals from those of the planet’s atmosphere, enabling Webb to make more precise atmospheric measurements.”
Astronomers can sample an exoplanet’s atmosphere when it passes in front of its star as seen from our perspective, an event called a transit. Part of the star’s light skims the atmosphere before making its way to us. This interaction allows the light to interact with atmospheric substances, and their chemical fingerprints — dips in brightness at characteristic wavelengths — become imprinted in the light.
But our telescopes see light from the entire star as well, not just what’s grazing the planet. Stellar surfaces aren’t uniform. They sport hotter, unusually bright regions called faculae and cooler, darker regions similar to sunspots, both of which grow, shrink, and change position as the star rotates.
An artist’s concept of the Pandora mission, seen here without the thermal blanketing that will protect the spacecraft, observing a star and its transiting exoplanet.
NASA’s Goddard Space Flight Center/Conceptual Image Lab
Using a novel all-aluminum, 45-centimeter-wide (17 inches) telescope, jointly developed by Livermore and Corning Specialty Materials in Keene, New Hampshire, Pandora’s detectors will capture each star’s visible brightness and near-infrared spectrum at the same time, while also obtaining the transiting planet’s near-infrared spectrum. This combined data will enable the science team to determine the properties of stellar surfaces and cleanly separate star and planetary signals.
The observing strategy takes advantage of the mission’s ability to continuously observe its targets for extended periods, something flagship missions like Webb, which are in high demand, cannot regularly do.
Over the course of its year-long prime mission, Pandora will observe at least 20 exoplanets 10 times, with each stare lasting a total of 24 hours. Each observation will include a transit, which is when the mission will capture the planet’s spectrum.
Pandora is led by NASA’s Goddard Space Flight Center. Lawrence Livermore National Laboratory provides the mission’s project management and engineering. Pandora’s telescope was manufactured by Corning and developed collaboratively with Livermore, which also developed the imaging detector assemblies, the mission’s control electronics, and all supporting thermal and mechanical subsystems. The infrared sensor was provided by NASA Goddard. Blue Canyon Technologies provided the bus and is performing spacecraft assembly, integration, and environmental testing. NASA’s Ames Research Center in California’s Silicon Valley will perform the mission’s data processing. Pandora’s mission operations center is located at the University of Arizona, and a host of additional universities support the science team.
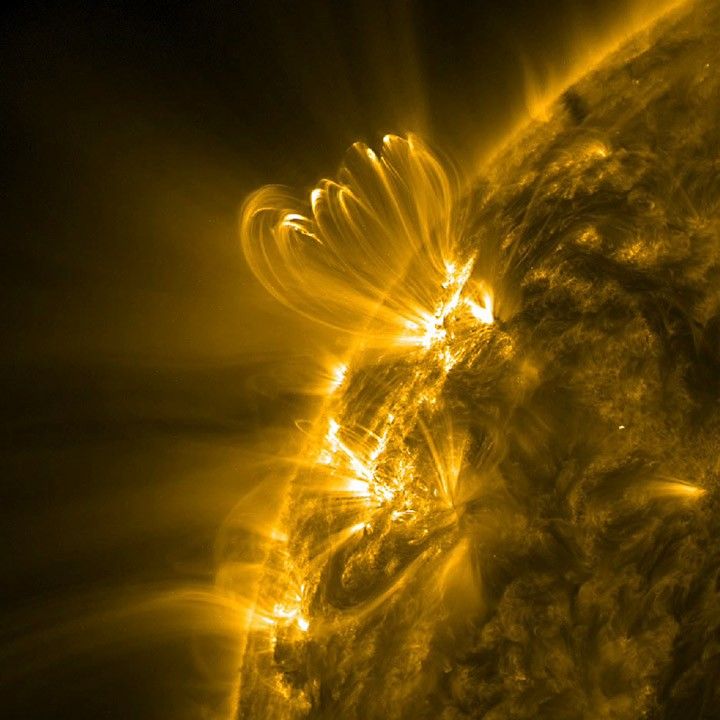
NASA Solar Observatory Sees Coronal Loops Flicker Before Big Flares
For decades, scientists have tried in vain to accurately predict solar flares — intense bursts of light on the Sun that can send a flurry of charged particles into the solar system. Now, using NASA’s Solar Dynamics Observatory, one team has identified flickering loops in the solar atmosphere, or corona, that seem to signal when the Sun is about to unleash a large flare.
These warning signs could help NASA and other stakeholders protect astronauts as well as technology both in space and on the ground from hazardous space weather.
NASA’s Solar Dynamics Observatory captured this image of coronal loops above an active region on the Sun in mid-January 2012. The image was taken in the 171 angstrom wavelength of extreme ultraviolet light.
NASA/Solar Dynamics Observatory
Led by heliophysicist Emily Mason of Predictive Sciences Inc. in San Diego, California, the team studied arch-like structures called coronal loops along the edge of the Sun. Coronal loops rise from magnetically driven active regions on the Sun, where solar flares also originate.
The team looked at coronal loops near 50 strong solar flares, analyzing how their brightness in extreme ultraviolet light varied in the hours before a flare compared to loops above non-flaring regions. Like flashing warning lights, the loops above flaring regions varied much more than those above non-flaring regions.
“We found that some of the extreme ultraviolet light above active regions flickers erratically for a few hours before a solar flare,” Mason explained. “The results are really important for understanding flares and may improve our ability to predict dangerous space weather.”
Published in the Astrophysical Journal Letters in December 2024 and presented on Jan. 15, 2025, at a press conference during the 245th meeting of the American Astronomical Society, the results also hint that the flickering reaches a peak earlier for stronger flares. However, the team says more observations are needed to confirm this link.
The four panels in this movie show brightness changes in coronal loops in four different wavelengths of extreme ultraviolet light (131, 171, 193, and 304 angstroms) before a solar flare in December 2011. The images were taken by the Atmospheric Imaging Assembly (AIA) on NASA’s Solar Dynamics Observatory and processed to reveal flickering in the coronal loops.
Other researchers have tried to predict solar flares by examining magnetic fields on the Sun, or by looking for consistent trends in other coronal loop features. However, Mason and her colleagues believe that measuring the brightness variations in coronal loops could provide more precise warnings than those methods — signaling oncoming flares 2 to 6 hours ahead of time with 60 to 80 percent accuracy.
“A lot of the predictive schemes that have been developed are still predicting the likelihood of flares in a given time period and not necessarily exact timing,” said team member Seth Garland of the Air Force Institute of Technology at Wright-Patterson Air Force Base in Ohio.
Each solar flare is like a snowflake — every single flare is unique.
Kara kniezewski
Air Force Institute of Technology
“The Sun’s corona is a dynamic environment, and each solar flare is like a snowflake — every single flare is unique,” said team member Kara Kniezewski, a graduate student at the Air Force Institute of Technology and lead author of the paper. “We find that searching for periods of ‘chaotic’ behavior in the coronal loop emission, rather than specific trends, provide a much more consistent metric and may also correlate with how strong a flare will be.”
The scientists hope their findings about coronal loops can eventually be used to help keep astronauts, spacecraft, electrical grids, and other assets safe from the harmful radiation that accompanies solar flares. For example, an automated system could look for brightness changes in coronal loops in real-time images from the Solar Dynamics Observatory and issue alerts.
“Previous work by other researchers reports some interesting prediction metrics,” said co-author Vadim Uritsky of NASA’s Goddard Space Flight Center in Greenbelt, Maryland, and the Catholic University of Washington in D.C. “We could build on this and come up with a well-tested and, ideally, simpler indicator ready for the leap from research to operations.”
By Vanessa Thomas NASA’s Goddard Space Flight Center, Greenbelt, Md.