Normal view

Before yesterdayMain stream

NASA’s SPHEREx Space Telescope Will Seek Life’s Ingredients

13 February 2025 at 10:27

5 min read

Preparations for Next Moonwalk Simulations Underway (and Underwater)

Molecular clouds in the Milky Way galaxy
NASA’s SPHEREx mission will survey the Milky Way galaxy looking for water ice and other key ingredients for life. In the search for these frozen compounds, the mission will focus on molecular clouds — collections of gas and dust in space — like this one imaged by the agency’s James Webb Space Telescope.
NASA, ESA, CSA

Where is all the water that may form oceans on distant planets and moons? The SPHEREx astrophysics mission will search the galaxy and take stock.

Every living organism on Earth needs water to survive, so scientists searching for life outside our solar system, are often guided by the phrase “follow the water.” Scheduled to launch no earlier than Thursday, Feb. 27, NASA’s SPHEREx (Spectro-Photometer for the History of the Universe, Epoch of Reionization, and Ices Explorer) mission will help in that quest.

After its ride aboard a SpaceX Falcon 9 from Vandenberg Space Force base in California, the observatory will search for water, carbon dioxide, carbon monoxide, and other key ingredients for life frozen on the surface of interstellar dust grains in the clouds of gas and dust where planets and stars eventually form.

While there are no oceans or lakes floating freely in space, scientists think these reservoirs of ice, bound to small dust grains, are where most of the water in our universe forms and resides. Additionally, the water in Earth’s oceans as well as those of other planets and moons in our galaxy likely originated in such locations.

Perseus Molecular Cloud, located about 1,000 light-years from Earth
The Perseus Molecular Cloud, located about 1,000 light-years from Earth, was imaged by NASA’s retired Spitzer Space Telescope. NASA’s SPHEREx mission will search the galaxy for water ice and other frozen compounds in clouds of gas and dust in space like this one.
NASA/JPL-Caltech

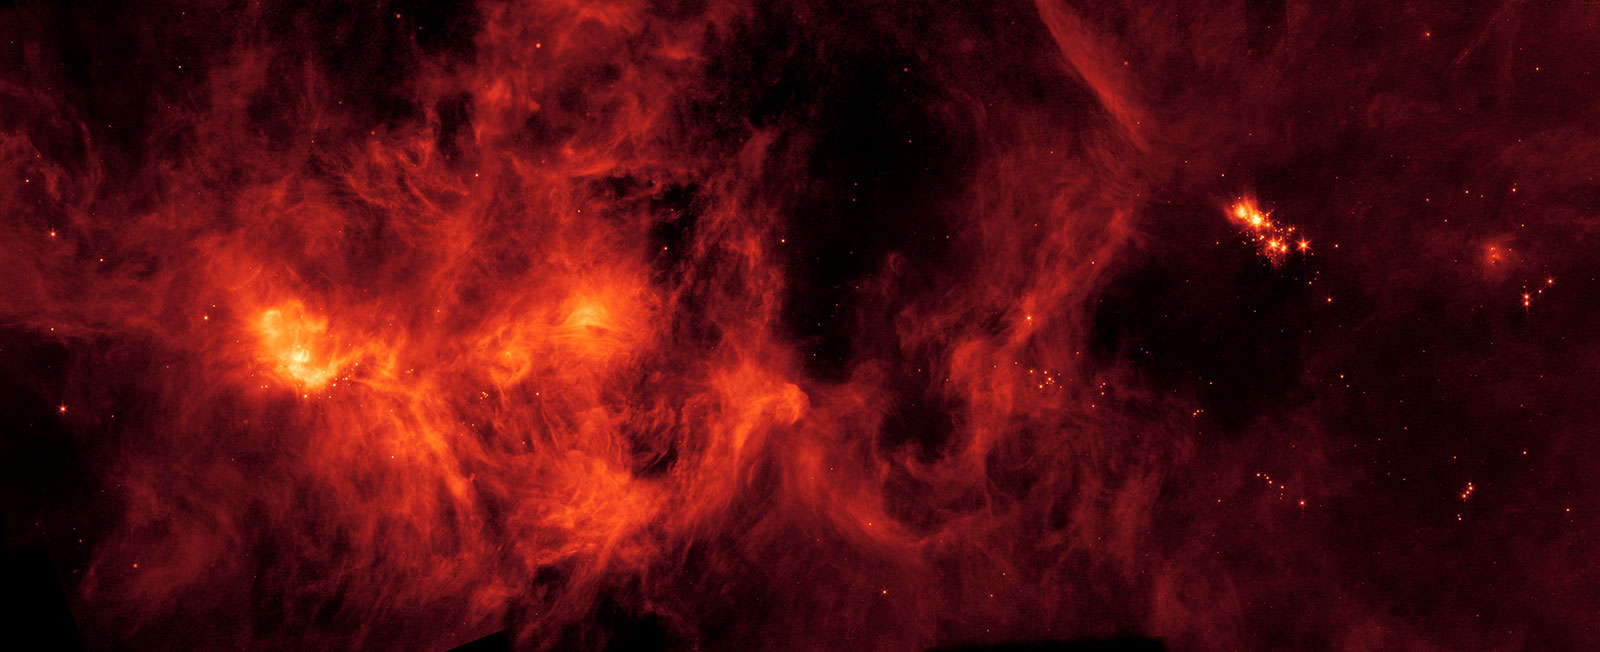
The mission will focus on massive regions of gas and dust called molecular clouds. Within those, SPHEREx will also look at some newly formed stars and the disks of material around them from which new planets are born.

Although space telescopes such as NASA’s James Webb and retired Spitzer have detected water, carbon dioxide, carbon monoxide, and other compounds in hundreds of targets, the SPHEREx observatory is the first to be uniquely equipped to conduct a large-scale survey of the galaxy in search of water ice and other frozen compounds.

Rather than taking 2D images of a target like a star, SPHEREx will gather 3D data along its line of sight. That enables scientists to see the amount of ice present in a molecular cloud and observe how the composition of the ices throughout the cloud changes in different environments.

By making more than 9 million of these line-of-sight observations and creating the largest-ever survey of these materials, the mission will help scientists better understand how these compounds form on dust grains and how different environments can influence their abundance.  

Tip of the Iceberg

It makes sense that the composition of planets and stars would reflect the molecular clouds they formed in. However, researchers are still working to confirm the specifics of the planet formation process, and the universe doesn’t always match scientists’ expectations.

For example, a NASA mission launched in 1998, the Submillimeter Wave Astronomy Satellite (SWAS), surveyed the galaxy for water in gas form — including in molecular clouds — but found far less than expected.

BAE Systems employees work on NASA’s SPHEREx observatory in the Astrotech Space Operations facility
BAE Systems employees work on NASA’s SPHEREx observatory in the Astrotech Space Operations facility at Vandenberg Space Force Base in California on Jan. 16. Targeting a Feb. 27 launch, the mission will map the entire sky in infrared light.
NASA/JPL-Caltech

“This puzzled us for a while,” said Gary Melnick, a senior astronomer at the Center for Astrophysics | Harvard & Smithsonian and a member of the SPHEREx science team. “We eventually realized that SWAS had detected gaseous water in thin layers near the surface of molecular clouds, suggesting that there might be a lot more water inside the clouds, locked up as ice.”

The mission team’s hypothesis also made sense because SWAS detected less oxygen gas (two oxygen atoms bound together) than expected. They concluded that the oxygen atoms were sticking to interstellar dust grains, and were then joined by hydrogen atoms, forming water. Later research confirmed this. What’s more, the clouds shield molecules from cosmic radiation that would otherwise break those compounds apart. As a result, water ice and other materials stored deep in a cloud’s interior are protected.

As starlight passes through a molecular cloud, molecules like water and carbon dioxide block certain wavelengths of light, creating a distinct signature that SPHEREx and other missions like Webb can identify using a technique called absorption spectroscopy.

In addition to providing a more detailed accounting of the abundance of these frozen compounds, SPHEREx will help researchers answer questions including how deep into molecular clouds ice begins to form, how the abundance of water and other ices changes with the density of a molecular cloud, and how that abundance changes once a star forms.

Powerful Partnerships

As a survey telescope, SPHEREx is designed to study large portions of the sky relatively quickly, and its results can be used in conjunction with data from targeted telescopes like Webb, which observe a significantly smaller area but can see their targets in greater detail.

“If SPHEREx discovers a particularly intriguing location, Webb can study that target with higher spectral resolving power and in wavelengths that SPHEREx cannot detect,” said Melnick. “These two telescopes could form a highly effective partnership.”

More About SPHEREx

SPHEREx is managed by NASA’s Jet Propulsion Laboratory in Southern California for the Astrophysics Division within the Science Mission Directorate at NASA Headquarters in Washington. BAE Systems (formerly Ball Aerospace) built the telescope and the spacecraft bus. The science analysis of the SPHEREx data will be conducted by a team of scientists located at 10 institutions in the U.S., two in South Korea, and one in Taiwan. Data will be processed and archived at IPAC at Caltech, which manages JPL for NASA. The mission principal investigator is based at Caltech with a joint JPL appointment. The SPHEREx dataset will be publicly available at the NASA/IPAC Infrared Science Archive.

For more information about the SPHEREx mission visit:

https://www.jpl.nasa.gov/missions/spherex/

News Media Contact

Calla Cofield
Jet Propulsion Laboratory, Pasadena, Calif.
626-808-2469
calla.e.cofield@jpl.nasa.gov

2025-020

How NASA’s Lunar Trailblazer Will Make a Looping Voyage to the Moon

13 February 2025 at 15:21

6 min read

Preparations for Next Moonwalk Simulations Underway (and Underwater)

NASA’s Lunar Trailblazer approaches the Moon as it enters its science orbit in this artist’s concept
NASA’s Lunar Trailblazer approaches the Moon as it enters its science orbit in this artist’s concept. The small satellite will orbit about 60 miles (100 kilometers) above the lunar surface, producing the best-yet maps of water on the Moon.
Lockheed Martin Space
NASA’s Lunar Trailblazer spacecraft gets covered in anti-static wrap
NASA’s Lunar Trailblazer spacecraft gets covered in anti-static wrap before being shipped from Lockheed Martin Space in Littleton, Colorado, to the agency’s Kennedy Space Center in Florida, where it arrived on Jan. 29.
Lockheed Martin Space

Before arriving at the Moon, the small satellite mission will use the gravity of the Sun, Earth, and Moon over several months to gradually line up for capture into lunar orbit.

NASA’s Lunar Trailblazer arrived in Florida recently in advance of its launch later this month and has been integrated with a SpaceX Falcon 9 rocket. Shipped from Lockheed Martin Space in Littleton, Colorado, the small satellite is riding along on Intuitive Machines’ IM-2 launch — part of NASA’s CLPS (Commercial Lunar Payload Services) initiative — which is slated for no earlier than Thursday, Feb. 26, from Launch Complex 39A at the agency’s Kennedy Space Center.

Approximately 48 minutes after launch, Lunar Trailblazer will separate from the rocket and begin its independent flight to the Moon. The small satellite will discover where the Moon’s water is, what form it is in, and how it changes over time, producing the best-yet maps of water on the lunar surface. Observations gathered during its two-year prime mission will contribute to the understanding of water cycles on airless bodies throughout the solar system while also supporting future human and robotic missions to the Moon by identifying where water is located.

Key to achieving these goals are the spacecraft’s two state-of-the-art science instruments: the High-resolution Volatiles and Minerals Moon Mapper (HVM3) infrared spectrometer and the Lunar Thermal Mapper (LTM) infrared multispectral imager. The HVM3 instrument was provided by NASA’s Jet Propulsion Laboratory in Southern California and LTM was built by the University of Oxford and funded by the UK Space Agency.

Lunar Trailblazer’s voyage to the Moon
Lunar Trailblazer’s voyage to the Moon will take between four and seven months, de-pending on the day it launches. This orbital diagram shows the low-energy transfer trajectory of the NASA mission should it launch on Feb. 26, the earliest date in its launch period.
NASA/JPL-Caltech

“The small team is international in scope, which is more typical of larger projects,” said Andy Klesh, Lunar Trailblazer’s project systems engineer at JPL. “And unlike the norm for small missions that may only have a very focused, singular purpose, Lunar Trailblazer has two high-fidelity instruments onboard. We are really punching above our weight.”

Intricate Navigation

Before it can use these instruments to collect science data, Lunar Trailblazer will for several months perform a series of Moon flybys, thruster bursts, and looping orbits. These highly choreographed maneuvers will eventually position the spacecraft so it can map the surface in great detail.

Weighing only 440 pounds (200 kilograms) and measuring 11.5 feet (3.5 meters) wide when its solar panels are fully deployed, Lunar Trailblazer is about the size of a dishwasher and has a relatively small engine. To make its four-to-seven-month trip to the Moon (depending on the launch date) as efficient as possible, the mission’s design and navigation team has planned a trajectory that will use the gravity of the Sun, Earth, and Moon to guide the spacecraft — a technique called low-energy transfer.

“The initial boost provided by the rocket will send the spacecraft past the Moon and into deep space, and its trajectory will then be naturally reshaped by gravity after several lunar flybys and loops around Earth. This will allow it to be captured into lunar orbit with minimal propulsion needs,” said Gregory Lantoine, Lunar Trailblazer’s mission design and navigation lead at JPL. “It’s the most fuel-efficient way to get to where we need to go.”

As it flies past the Moon several times, the spacecraft will use small thruster bursts — aka trajectory correction maneuvers — to slowly change its orbit from highly elliptical to circular, bringing the satellite down to an altitude of about 60 miles (100 kilometers) above the Moon’s surface.

Arriving at the Moon

Once in its science orbit, Lunar Trailblazer will glide over the Moon’s surface, making 12 orbits a day and observing the surface at a variety of different times of day over the course of the mission. The satellite will also be perfectly placed to peer into the permanently shadowed craters at the Moon’s South Pole, which harbor cold traps that never see direct sunlight. If Lunar Trailblazer finds significant quantities of ice at the base of the craters, those locations could be pinpointed as a resource for future lunar explorers.

The data the mission collects will be transmitted to NASA’s Deep Space Network and delivered to Lunar Trailblazer’s new operations center at Caltech’s IPAC in Pasadena, California. Working alongside the mission’s experienced team will be students from Caltech and nearby Pasadena City College who are involved in all aspects of the mission, from operations and communications to developing software.

Lunar Trailblazer was a selection of NASA’s SIMPLEx (Small Innovative Missions for Planetary Exploration), which provides opportunities for low-cost science spacecraft to ride-share with selected primary missions. To maintain the lower overall cost, SIMPLEx missions have a higher risk posture and lighter requirements for oversight and management. This higher risk acceptance allows NASA to test pioneering technologies, and the definition of success for these missions includes the lessons learned from more experimental endeavors.

“We are a small mission with groundbreaking science goals, so we will succeed by embracing the flexibility that’s built into our organization,” said Lee Bennett, Lunar Trailblazer operations lead with IPAC. “Our international team consists of seasoned engineers, science team members from several institutions, and local students who are being given the opportunity to work on a NASA mission for the first time.”

More About Lunar Trailblazer

Lunar Trailblazer is led by Principal Investigator Bethany Ehlmann of Caltech in Pasadena, California. Caltech also leads the mission’s science investigation and mission operations. This includes planning, scheduling, and sequencing of all science, instrument, and spacecraft activities during the nominal mission. Science data processing will be done in the Bruce Murray Laboratory for Planetary Visualization at Caltech. NASA’s Jet Propulsion Laboratory in Southern California manages Lunar Trailblazer and provides system engineering, mission assurance, the HVM3 instrument, and mission design and navigation. Lockheed Martin Space provides the spacecraft, integrates the flight system, and supports operations under contract with Caltech. University of Oxford developed and provided the LTM instrument. Part of NASA’s Lunar Discovery Exploration Program, the mission is managed by NASA’s Planetary Mission Program Office at Marshall Space Flight Center in Huntsville, Alabama, for the agency’s Science Mission Directorate in Washington.

For more information about Lunar Trailblazer, visit:

https://www.jpl.nasa.gov/missions/lunar-trailblazer

News Media Contacts

Karen Fox / Molly Wasser
NASA Headquarters, Washington
202-358-1600
karen.c.fox@nasa.gov / molly.l.wasser@nasa.gov

Ian J. O’Neill
Jet Propulsion Laboratory, Pasadena, Calif.
818-354-2649
ian.j.oneill@jpl.nasa.gov

Isabel Swafford
Caltech IPAC
626-216-4257
iswafford@ipac.caltech.edu

2025-021

NASA’s Curiosity Rover Captures Colorful Clouds Drifting Over Mars

11 February 2025 at 13:00

5 min read

Preparations for Next Moonwalk Simulations Underway (and Underwater)

NASA’s Curiosity Mars rover captured these drifting noctilucent, or twilight, clouds in a 16-minute recording on Jan. 17. (This looping clip has been speeded up about 480 times.) The white plumes falling out of the clouds are carbon dioxide ice that would evaporate closer to the Martian surface.
NASA/JPL-Caltech/MSSS/SSI

While the Martian clouds may look like the kind seen in Earth’s skies, they include frozen carbon dioxide, or dry ice.

Red-and-green-tinted clouds drift through the Martian sky in a new set of images captured by NASA’s Curiosity rover using its Mastcam — its main set of “eyes.” Taken over 16 minutes on Jan. 17 (the 4,426th Martian day, or sol, of Curiosity’s mission), the images show the latest observations of what are called noctilucent (Latin for “night shining”), or twilight clouds, tinged with color by scattering light from the setting Sun.

Sometimes these clouds even create a rainbow of colors, producing iridescent, or “mother-of-pearl” clouds. Too faint to be seen in daylight, they’re only visible when the clouds are especially high and evening has fallen.

Martian clouds are made of either water ice or, at higher altitudes and lower temperatures, carbon dioxide ice. (Mars’ atmosphere is more than 95% carbon dioxide.) The latter are the only kind of clouds observed at Mars producing iridescence, and they can be seen near the top of the new images at an altitude of around 37 to 50 miles (60 to 80 kilometers). They’re also visible as white plumes falling through the atmosphere, traveling as low as 31 miles (50 kilometers) above the surface before evaporating because of rising temperatures. Appearing briefly at the bottom of the images are water-ice clouds traveling in the opposite direction roughly 31 miles (50 kilometers) above the rover.

Dawn of Twilight Clouds

Twilight clouds were first seen on Mars by NASA’s Pathfinder mission in 1997; Curiosity didn’t spot them until 2019, when it acquired its first-ever images of iridescence in the clouds. This is the fourth Mars year the rover has observed the phenomenon, which occurs during early fall in the southern hemisphere.

Mark Lemmon, an atmospheric scientist with the Space Science Institute in Boulder, Colorado, led a paper summarizing Curiosity’s first two seasons of twilight cloud observations, which published late last year in Geophysical Research Letters. “I’ll always remember the first time I saw those iridescent clouds and was sure at first it was some color artifact,” he said. “Now it’s become so predictable that we can plan our shots in advance; the clouds show up at exactly the same time of year.”

Each sighting is an opportunity to learn more about the particle size and growth rate in Martian clouds. That, in turn, provides more information about the planet’s atmosphere.

Cloud Mystery

One big mystery is why twilight clouds made of carbon dioxide ice haven’t been spotted in other locations on Mars. Curiosity, which landed in 2012, is on Mount Sharp in Gale Crater, just south of the Martian equator. Pathfinder landed in Ares Vallis, north of the equator. NASA’s Perseverance rover, located in the northern hemisphere’s Jezero Crater, hasn’t seen any carbon dioxide ice twilight clouds since its 2021 landing. Lemmon and others suspect that certain regions of Mars may be predisposed to forming them.

A possible source of the clouds could be gravity waves, he said, which can cool the atmosphere: “Carbon dioxide was not expected to be condensing into ice here, so something is cooling it to the point that it could happen. But Martian gravity waves are not fully understood and we’re not entirely sure what is causing twilight clouds to form in one place but not another.”

Mastcam’s Partial View

The new twilight clouds appear framed in a partially open circle. That’s because they were taken using one of Mastcam’s two color cameras: the left 34 mm focal length Mastcam, which has a filter wheel that is stuck between positions. Curiosity’s team at NASA’s Jet Propulsion Laboratory in Southern California remains able to use both this camera and the higher-resolution right 100 mm focal length camera for color imaging.

The rover recently wrapped an investigation of a place called Gediz Vallis channel and is on its way to a new location that includes boxwork — fractures formed by groundwater that look like giant spiderwebs when viewed from space.

More recently, Curiosity visited an impact crater nicknamed “Rustic Canyon,” capturing it in images and studying the composition of rocks around it. The crater, 67 feet (20 meters) in diameter, is shallow and has lost much of its rim to erosion, indicating that it likely formed many millions of years ago. One reason Curiosity’s science team studies craters is because the cratering process can unearth long-buried materials that may have better preserved organic molecules than rocks exposed to radiation at the surface. These molecules provide a window into the ancient Martian environment and how it could have supported microbial life billions of years ago, if any ever formed on the Red Planet.

More About Curiosity

Curiosity was built by NASA’s Jet Propulsion Laboratory, which is managed by Caltech in Pasadena, California. JPL leads the mission on behalf of NASA’s Science Mission Directorate in Washington. Malin Space Science Systems in San Diego built and operates Mastcam.

For more about Curiosity, visit:

science.nasa.gov/mission/msl-curiosity

News Media Contacts

Andrew Good
Jet Propulsion Laboratory, Pasadena, Calif.
818-393-2433
andrew.c.good@jpl.nasa.gov

Karen Fox / Molly Wasser
NASA Headquarters, Washington
202-358-1600
karen.c.fox@nasa.gov / molly.l.wasser@nasa.gov

2025-017

NASA’s Mini Rover Team Is Packed for Lunar Journey

11 February 2025 at 14:38

4 min read

Preparations for Next Moonwalk Simulations Underway (and Underwater)

A team at JPL packed up three small Moon rovers, delivering them in February to the facility where they’ll be attached to a commercial lunar lander in preparation for launch. The rovers are part of a project called CADRE that could pave the way for potential future multirobot missions. NASA/JPL-Caltech

A trio of suitcase-size rovers and their base station have been carefully wrapped up and shipped off to join the lander that will deliver them to the Moon’s surface.

Three small NASA rovers that will explore the lunar surface as a team have been packed up and shipped from the agency’s Jet Propulsion Laboratory in Southern California, marking completion of the first leg of the robots’ journey to the Moon.

The rovers are part of a technology demonstration called CADRE (Cooperative Autonomous Distributed Robotic Exploration), which aims to show that a group of robots can collaborate to gather data without receiving direct commands from mission controllers on Earth. They’ll use their cameras and ground-penetrating radars to send back imagery of the lunar surface and subsurface while testing out the novel software that enables them to work together autonomously.

The CADRE rovers will launch to the Moon aboard IM-3, Intuitive Machines’ third lunar delivery, which has a mission window that extends into early 2026, as part of NASA’s CLPS (Commercial Lunar Payload Services) initiative. Once installed on Intuitive Machines’ Nova-C lander, they’ll head to the Reiner Gamma region on the western edge of the Moon’s near side, where the solar-powered, suitcase-size rovers will spend the daylight hours of a lunar day (the equivalent of about 14 days on Earth) carrying out experiments. The success of CADRE could pave the way for potential future missions with teams of autonomous robots supporting astronauts and spreading out to take simultaneous, distributed scientific measurements.

Members of a JPL team working on NASA’s CADRE
Members of a JPL team working on NASA’s CADRE technology demonstration use temporary red handles to move one of the project’s small Moon rovers to prepare it for transport to Intuitive Machines’ Houston facility, where it will be attached to the company’s third lunar lander.
NASA/JPL-Caltech

Construction of the CADRE hardware — along with a battery of rigorous tests to prove readiness for the journey through space — was completed in February 2024.

To get prepared for shipment to Intuitive Machines’ Houston facility, each rover was attached to its deployer system, which will lower it via tether from the lander onto the dusty lunar surface. Engineers flipped each rover-deployer pair over and attached it to an aluminum plate for safe transit. The rovers were then sealed in protective metal-frame enclosures that were fitted snuggly into metal shipping containers and loaded onto a truck. The hardware arrived safely on Sunday, Feb. 9.

“Our small team worked incredibly hard constructing these robots and putting them to the test, and we have been eagerly waiting for the moment where we finally see them on their way,” said Coleman Richdale, the team’s assembly, test, and launch operations lead at JPL. “We are all genuinely thrilled to be taking this next step in our journey to the Moon, and we can’t wait to see the lunar surface through CADRE’s eyes.”

The rovers, the base station, and a camera system that will monitor CADRE experiments on the Moon will be integrated with the lander — as will several other NASA payloads — in preparation for the launch of the IM-3 mission.

More About CADRE

A division of Caltech in Pasadena, California, JPL manages CADRE for the Game Changing Development program within NASA’s Space Technology Mission Directorate. The technology demonstration was selected under the agency’s Lunar Surface Innovation Initiative, which was established to expedite the development of technologies for sustained presence on the lunar surface. NASA’s Science Mission Directorate manages the CLPS initiative. The agency’s Glenn Research Center in Cleveland and its Ames Research Center in Silicon Valley, California, both supported the project. Motiv Space Systems designed and built key hardware elements at the company’s Pasadena facility. Clemson University in South Carolina contributed research in support of the project.

For more about CADRE, go to:

https://go.nasa.gov/cadre

News Media Contact

Melissa Pamer
Jet Propulsion Laboratory, Pasadena, Calif.
626-314-4928
melissa.pamer@jpl.nasa.gov

2025-018

NASA-Led Study Pinpoints Areas Sinking, Rising Along California Coast

10 February 2025 at 11:03

5 min read

Preparations for Next Moonwalk Simulations Underway (and Underwater)

San Simeon
Cliffs slope into the ocean in San Simeon, California. All along the state’s dynamic coastline, land is inching down and up due to natural and human-caused factors. A better understanding of this motion can help communities prepare for rising seas.
NASA/JPL-Caltech

The elevation changes may seem small — amounting to fractions of inches per year — but they can increase or decrease local flood risk, wave exposure, and saltwater intrusion.

Tracking and predicting sea level rise involves more than measuring the height of our oceans: Land along coastlines also inches up and down in elevation. Using California as a case study, a NASA-led team has shown how seemingly modest vertical land motion could significantly impact local sea levels in coming decades.

By 2050, sea levels in California are expected to increase between 6 and 14.5 inches (15 and 37 centimeters) higher than year 2000 levels. Melting glaciers and ice sheets, as well as warming ocean water, are primarily driving the rise. As coastal communities develop adaptation strategies, they can also benefit from a better understanding of the land’s role, the team said. The findings are being used in updated guidance for the state.

“In many parts of the world, like the reclaimed ground beneath San Francisco, the land is moving down faster than the sea itself is going up,” said lead author Marin Govorcin, a remote sensing scientist at NASA’s Jet Propulsion Laboratory in Southern California. 

The new study illustrates how vertical land motion can be unpredictable in scale and speed; it results from both human-caused factors such as groundwater pumping and wastewater injection, as well as from natural ones like tectonic activity. The researchers showed how direct satellite observations can improve estimates of vertical land motion and relative sea level rise. Current models, which are based on tide gauge measurements, cannot cover every location and all the dynamic land motion at work within a given region.

Local Changes

Researchers from JPL and the National Oceanic and Atmospheric Administration (NOAA) used satellite radar to track more than a thousand miles of California coast rising and sinking in new detail. They pinpointed hot spots including cities, beaches, and aquifers at greater exposure to rising seas now and in coming decades.

To capture localized motion inch by inch from space, the team analyzed radar measurements made by ESA’s (the European Space Agency’s) Sentinel-1 satellites, as well as motion velocity data from ground-based receiving stations in the Global Navigation Satellite System. Researchers compared multiple observations of the same locations made between 2015 to 2023 using a processing technique called interferometric synthetic aperture radar (InSAR).

Scientists mapped land sinking in coastal California cities
Scientists mapped land sinking (indicated in blue) in coastal California cities and in parts of the Central Valley due to factors like soil compaction, erosion, and groundwater withdrawal. They also tracked uplift hot spots (shown in red), including in Long Beach, a site of oil and gas production.
NASA Earth Observatory

Homing in on the San Francisco Bay Area specifically, San Rafael, Corte Madera, Foster City, and Bay Farm Island the team found the land subsiding at a steady rate of more than 0.4 inches (10 millimeters) per year due largely to sediment compaction. Accounting for this subsidence in the lowest-lying parts of these areas, local sea levels could rise more than 17 inches (45 centimeters) by 2050. That’s more than double the regional estimate of 7.4 inches (19 centimeters) based solely on tide gauge projections.

Not all coastal locations in California are sinking. The researchers mapped uplift hot spots of several millimeters per year in the Santa Barbara groundwater basin, which has been steadily replenishing since 2018. They also observed uplift in Long Beach, where fluid extraction and injection occur with oil and gas production.

The scientists further calculated how human-induced drivers of local land motion increase uncertainties in the sea level projections by up to 15 inches (40 centimeters) in parts of Los Angeles and San Diego counties. Reliable projections in these areas are challenging because the unpredictable nature of human activities, such as hydrocarbon production and groundwater extraction, necessitating ongoing monitoring of land motion.  

Fluctuating Aquifers, Slow-Moving Landslides

In the middle of California, in the fast-sinking parts of the Central Valley (subsiding as much as 8 inches, or 20 centimeters, per year), land motion is influenced by groundwater withdrawal. Periods of drought and precipitation can alternately draw down or inflate underground aquifers. Such fluctuations were also observed over aquifers in Santa Clara in the San Francisco Bay Area, Santa Ana in Orange County, and Chula Vista in San Diego County.

Along rugged coastal terrain like the Big Sur mountains below San Francisco and Palos Verdes Peninsula in Los Angeles, the team pinpointed local zones of downward motion associated with slow-moving landslides. In Northern California they also found sinking trends at marshlands and lagoons around San Francisco and Monterey bays, and in Sonoma County’s Russian River estuary. Erosion in these areas likely played a key factor.

Scientists, decision-makers, and the public can monitor these and other changes occurring via the JPL-led OPERA (Observational Products for End-Users from Remote Sensing Analysis) project. The OPERA project details land surface elevational changes across North America, shedding light on dynamic processes including subsidence, tectonics, and landslides.

The OPERA project will leverage additional state-of-the-art InSAR data from the upcoming NISAR (NASA-Indian Space Research Organization Synthetic Aperture Radar) mission, expected to launch within the coming months.

News Media Contacts

Jane J. Lee / Andrew Wang
Jet Propulsion Laboratory, Pasadena, Calif.
818-354-0307 / 626-379-6874
jane.j.lee@jpl.nasa.gov / andrew.wang@jpl.nasa.gov

Written by Sally Younger

2025-015

6 Things to Know About SPHEREx, NASA’s Newest Space Telescope

31 January 2025 at 10:56

5 min read

Preparations for Next Moonwalk Simulations Underway (and Underwater)

NASA’s SPHEREx observatory undergoes testing
NASA’s SPHEREx observatory undergoes testing at BAE Systems in Boulder, Colorado, in August 2024. Launching no earlier than Feb. 27, 2025, the mission will make the first all-sky spectroscopic survey in the near-infrared, helping to answer some of the biggest questions in astrophysics.
BAE Systems/NASA/JPL-Caltech

Shaped like a megaphone, the upcoming mission will map the entire sky in infrared light to answer big questions about the universe.

Expected to launch no earlier than Thursday, Feb. 27, from Vandenberg Space Force Base in California, NASA’s SPHEREx space observatory will provide astronomers with a big-picture view of the cosmos like none before. Short for Spectro-Photometer for the History of the Universe, Epoch of Reionization and Ices Explorer, SPHEREx will map the entire celestial sky in 102 infrared colors, illuminating the origins of our universe, galaxies within it, and life’s key ingredients in our own galaxy. Here are six things to know about the mission.

1. The SPHEREx space telescope will shed light on a cosmic phenomenon called inflation.

In the first billionth of a trillionth of a trillionth of a second after the big bang, the universe increased in size by a trillion-trillionfold. Called inflation, this nearly instantaneous event took place almost 14 billion years ago, and its effects can be found today in the large-scale distribution of matter in the universe. By mapping the distribution of more than 450 million galaxies, SPHEREx will help scientists improve our understanding of the physics behind this extreme cosmic event.

2. The observatory will measure the collective glow from galaxies near and far.

Scientists have tried to estimate the total light output from all galaxies throughout cosmic history by observing individual galaxies and extrapolating to the trillions of galaxies in the universe. The SPHEREx space telescope will take a different approach and measure the total glow from all galaxies, including galaxies too small, too diffuse, or too distant for other telescopes to easily detect. Combining the measurement of this overall glow with other telescopes’ studies of individual galaxies will give scientists a more complete picture of all the major sources of light in the universe.

3. The mission will search the Milky Way galaxy for essential building blocks of life.

Life as we know it wouldn’t exist without basic ingredients such as water and carbon dioxide. The SPHEREx observatory is designed to find these molecules frozen in interstellar clouds of gas and dust, where stars and planets form. The mission will pinpoint the location and abundance of these icy compounds in our galaxy, giving researchers a better sense of their availability in the raw materials for newly forming planets.

Rho Ophiuchi dark cloud
Molecular clouds like this one, called Rho Ophiuchi, are collections of cold gas and dust in space where stars and planets can form. SPHEREx will survey such regions through-out the Milky Way galaxy to measure the abundance of water ice and other frozen mole-cules.
NASA/JPL-Caltech

4. It adds unique strengths to NASA’s fleet of space telescopes.

Space telescopes like NASA’s Hubble and Webb have zoomed in on many corners of the universe to show us planets, stars, and galaxies in high resolution. But some questions — like how much light do all the galaxies in the universe collectively emit? — can be answered only by looking at the big picture. To that end, the SPHEREx observatory will provide maps that encompass the entire sky. Objects of scientific interest identified by SPHEREx can then be studied in more detail by targeted telescopes like Hubble and Webb.

5. The SPHEREx observatory will make the most colorful all-sky map ever.

The SPHEREx observatory “sees” infrared light. Undetectable to the human eye, this range of wavelengths is ideal for studying stars and galaxies. Using a technique called spectroscopy, the telescope can split the light into its component colors (individual wavelengths), like a prism creates a rainbow from sunlight, in order to measure the distance to cosmic objects and learn about their composition. With SPHEREx’s spectroscopic map in hand, scientists will be able to detect evidence of chemical compounds, like water ice, in our galaxy. They’ll not only measure the total amount of light emitted by galaxies in our universe, but also discern how bright that total glow was at different points in cosmic history. And they’ll chart the 3D locations of hundreds of millions of galaxies to study how inflation influenced the large-scale structure of the universe today.

6. The spacecraft’s cone-shaped design helps it stay cold and see faint objects.

The mission’s infrared telescope and detectors need to operate at around minus 350 degrees Fahrenheit (about minus 210 degrees Celsius). This is partly to prevent them from generating their own infrared glow, which might overwhelm the faint light from cosmic sources. To keep things cold while also simplifying the spacecraft’s design and operational needs, SPHEREx relies on an entirely passive cooling system — no electricity or coolants are used during normal operations. Key to making this feat possible are three cone-shaped photon shields that protect the telescope from the heat of Earth and the Sun, as well as a mirrored structure beneath the shields to direct heat from the instrument out into space. Those photon shields give the spacecraft its distinctive outline.

More About SPHEREx

SPHEREx is managed by NASA’s Jet Propulsion Laboratory for the agency’s Astrophysics Division within the Science Mission Directorate at NASA Headquarters in Washington. BAE Systems (formerly Ball Aerospace) built the telescope and the spacecraft bus. The science analysis of the SPHEREx data will be conducted by a team of scientists located at 10 institutions in the U.S., two in South Korea, and one in Taiwan. Data will be processed and archived at IPAC at Caltech, which manages JPL for NASA. The mission principal investigator is based at Caltech with a joint JPL appointment. The SPHEREx dataset will be publicly available at the NASA/IPAC Infrared Science Archive.

For more information about the SPHEREx mission visit:

https://www.jpl.nasa.gov/missions/spherex

News Media Contact

Calla Cofield
Jet Propulsion Laboratory, Pasadena, Calif.
626-808-2469
calla.e.cofield@jpl.nasa.gov

2025-011

How Many Black Holes Are Hiding? NASA Study Homes in on Answer

13 January 2025 at 09:24

6 min read

Preparations for Next Moonwalk Simulations Underway (and Underwater)

A thick torus of gas and dust surrounding a supermassive black hole is shown in this artist’s concept. The torus can obscure light that’s generated by material falling into the black hole. Observations by NASA telescopes have helped scientists identify more of these hidden black holes.
NASA/JPL-Caltech

An effort to find some of the biggest, most active black holes in the universe provides a better estimate for the ratio of hidden to unhidden behemoths.

Multiple NASA telescopes recently helped scientists search the sky for supermassive black holes — those up to billions of times heavier than the Sun. The new survey is unique because it was as likely to find massive black holes that are hidden behind thick clouds of gas and dust as those that are not.

Astronomers think that every large galaxy in the universe has a supermassive black hole at its center. But testing this hypothesis is difficult because researchers can’t hope to count the billions or even trillions of supermassive black holes thought to exist in the universe. Instead they have to extrapolate from smaller samples to learn about the larger population. So accurately measuring the ratio of hidden supermassive black holes in a given sample helps scientists better estimate the total number of supermassive black holes in the universe.

The new study published in the Astrophysical Journal found that about 35% of supermassive black holes are heavily obscured, meaning the surrounding clouds of gas and dust are so thick they block even low-energy X-ray light. Comparable searches have previously found less than 15% of supermassive black holes are so obscured. Scientists think the true split should be closer to 50/50 based on models of how galaxies grow. If observations continue to indicate significantly less than half of supermassive black holes are hidden, scientists will need to adjust some key ideas they have about these objects and the role they play in shaping galaxies.

Hidden Treasure

Although black holes are inherently dark — not even light can escape their gravity — they can also be some of the brightest objects in the universe: When gas gets pulled into orbit around a supermassive black hole, like water circling a drain, the extreme gravity creates such intense friction and heat that the gas reaches hundreds of thousands of degrees and radiates so brightly it can outshine all the stars in the surrounding galaxy.

The clouds of gas and dust that surround and replenish the bright central disk may roughly take the shape of a torus, or doughnut. If the doughnut hole is facing toward Earth, the bright central disk within it is visible; if the doughnut is seen edge-on, the disk is obscured.

A supermassive black hole surrounded by a torus of gas and dust is depicted in four different wavelengths of light
A supermassive black hole surrounded by a torus of gas and dust is depicted in four different wavelengths of light in this artist’s concept. Visible light (top right) and low-energy X-rays (bottom left) are blocked by the torus; infrared (top left) is scattered and reemitted; and some high energy X-rays (bottom right) can penetrate the torus.
NASA/JPL-Caltech

Most telescopes can rather easily identify face-on supermassive black holes, though not edge-on ones. But there’s an exception to this that the authors of the new paper took advantage of: The torus absorbs light from the central source and reemits lower-energy light in the infrared range (wavelengths slightly longer than what human eyes can detect). Essentially, the doughnuts glow in infrared.

These wavelengths of light were detected by NASA’s Infrared Astronomical Satellite, or IRAS, which operated for 10 months in 1983 and was managed by NASA’s Jet Propulsion Laboratory in Southern California. A survey telescope that imaged the entire sky, IRAS was able to see the infrared emissions from the clouds surrounding supermassive black holes. Most importantly, it could spot edge-on and face-on black holes equally well.

IRAS caught hundreds of initial targets. Some of them turned out to be not heavily obscured black holes but galaxies with high rates of star formation that emit a similar infrared glow. So the authors of the new study used ground-based, visible-light telescopes to identify those galaxies and separate them from the hidden black holes.

To confirm edge-on, heavily obscured black holes, the researchers relied on NASA’s NuSTAR (Nuclear Spectroscopic Telescope Array), an X-ray observatory also managed by JPL. X-rays are radiated by some of the hottest material around the black hole. Lower-energy X-rays are absorbed by the surrounding clouds of gas and dust, while the higher-energy X-rays observed by NuSTAR can penetrate and scatter off the clouds. Detecting these X-rays can take hours of observation, so scientists working with NuSTAR first need a telescope like IRAS to tell them where to look.

NASA’s NuSTAR X-ray telescope, depicted in this artist’s concept
NASA’s NuSTAR X-ray telescope, depicted in this artist’s concept, has helped astronomers get a better sense of how many supermassive black holes are hidden from view by thick clouds of gas and dust that surround them.
NASA/JPL-Caltech

“It amazes me how useful IRAS and NuSTAR were for this project, especially despite IRAS being operational over 40 years ago,” said study lead Peter Boorman, an astrophysicist at Caltech in Pasadena, California. “I think it shows the legacy value of telescope archives and the benefit of using multiple instruments and wavelengths of light together.”

Numerical Advantage

Determining the number of hidden black holes compared to nonhidden ones can help scientists understand how these black holes get so big. If they grow by consuming material, then a significant number of black holes should be surrounded by thick clouds and potentially obscured. Boorman and his coauthors say their study supports this hypothesis.

In addition, black holes influence the galaxies they live in, mostly by impacting how galaxies grow. This happens because black holes surrounded by massive clouds of gas and dust can consume vast — but not infinite — amounts of material. If too much falls toward a black hole at once, the black hole starts coughing up the excess and firing it back out into the galaxy. That can disperse gas clouds within the galaxy where stars are forming, slowing the rate of star formation there.

“If we didn’t have black holes, galaxies would be much larger,” said Poshak Gandhi, a professor of astrophysics at the University of Southampton in the United Kingdom and a coauthor on the new study. “So if we didn’t have a supermassive black hole in our Milky Way galaxy, there might be many more stars in the sky. That’s just one example of how black holes can influence a galaxy’s evolution.”

More About NuSTAR

A Small Explorer mission led by Caltech and managed by NASA’s Jet Propulsion Laboratory in Southern California for the agency’s Science Mission Directorate in Washington, NuSTAR was developed in partnership with the Danish Technical University and the Italian Space Agency (ASI). The spacecraft was built by Orbital Sciences Corp. in Dulles, Virginia. NuSTAR’s mission operations center is at the University of California, Berkeley, and the official data archive is at NASA’s High Energy Astrophysics Science Archive Research Center at NASA’s Goddard Space Flight Center. ASI provides the mission’s ground station and a mirror data archive. Caltech manages JPL for NASA.

For more information on NuSTAR, visit:

www.nustar.caltech.edu

News Media Contact

Calla Cofield
Jet Propulsion Laboratory, Pasadena, Calif.
626-808-2469
calla.e.cofield@jpl.nasa.gov

2025-002

How US-Indian NISAR Satellite Will Offer Unique Window on Earth

6 January 2025 at 15:53

5 min read

Preparations for Next Moonwalk Simulations Underway (and Underwater)

artist’s concept depicts the NISAR satellite orbiting Earth over Antarctica
An equal collaboration between NASA and the Indian Space Research Organisation, NISAR will offer unprecedented insights into Earth’s constantly changing land and ice surfaces using synthetic aperture radar technology. The spacecraft, depicted here in an artist’s concept, will launch from India.
NASA/JPL-Caltech

A Q&A with the lead U.S. scientist of the mission, which will track changes in everything from wetlands to ice sheets to infrastructure damaged by natural disasters.

The upcoming U.S.-India NISAR (NASA-ISRO Synthetic Aperture Radar) mission will observe Earth like no mission before, offering insights about our planet’s ever-changing surface.

The NISAR mission is a first-of-a-kind dual-band radar satellite that will measure land deformation from earthquakes, landslides, and volcanoes, producing data for science and disaster response. It will track how much glaciers and ice sheets are advancing or retreating and it will monitor growth and loss of forests and wetlands for insights on the global carbon cycle.

As diverse as NISAR’s impact will be, the mission’s winding path to launch — in a few months’ time — has also been remarkable. Paul Rosen, NISAR’s project scientist at NASA’s Jet Propulsion Laboratory in Southern California, has been there at every step. He recently discussed the mission and what sets it apart.

Paul Rosen
NISAR Project Scientist Paul Rosen of NASA’s Jet Propulsion Laboratory first traveled to India in late 2011 to discuss collaboration with ISRO scientists on an Earth-observing radar mission. NASA and ISRO signed an agreement in 2014 to develop NISAR.
NASA/JPL-Caltech

How will NISAR improve our understanding of Earth?

The planet’s surfaces never stop changing — in some ways small and subtle, and in other ways monumental and sudden. With NISAR, we’ll measure that change roughly every week, with each pixel capturing an area about half the size of a tennis court. Taking imagery of nearly all Earth’s land and ice surfaces this frequently and at such a small scale — down to the centimeter — will help us put the pieces together into one coherent picture to create a story about the planet as a living system.

What sets NISAR apart from other Earth missions?

NISAR will be the first Earth-observing satellite with two kinds of radar — an L-band system with a 10-inch (25-centimeter) wavelength and an S-band system with a 4-inch (10-centimeter) wavelength.

Whether microwaves reflect or penetrate an object depends on their wavelength. Shorter wavelengths are more sensitive to smaller objects such as leaves and rough surfaces, whereas longer wavelengths are more reactive with larger structures like boulders and tree trunks.

So NISAR’s two radar signals will react differently to some features on Earth’s surface. By taking advantage of what each signal is or isn’t sensitive to, researchers can study a broader range of features than they could with either radar on its own, observing the same features with different wavelengths.

Is this new technology?

The concept of a spaceborne synthetic aperture radar, or SAR, studying Earth’s processes dates to the 1970s, when NASA launched Seasat. Though the mission lasted only a few months, it produced first-of-a-kind images that changed the remote-sensing landscape for decades to come.

It also drew me to JPL in 1981 as a college student: I spent two summers analyzing data from the mission. Seasat led to NASA’s Shuttle Imaging Radar program and later to the Shuttle Radar Topography Mission.

What will happen to the data from the mission?

Our data products will fit the needs of users across the mission’s science focus areas — ecosystems, cryosphere, and solid Earth — plus have many uses beyond basic research like soil-moisture and water resources monitoring.

We’ll make the data easily accessible. Given the volume of the data, NASA decided that it would be processed and stored in the cloud, where it’ll be free to access.

How did the ISRO partnership come about?

We proposed DESDynI (Deformation, Ecosystem Structure, and Dynamics of Ice), an L-band satellite, following the 2007 Decadal Survey by the National Academy of Sciences. At the time, ISRO was exploring launching an S-band satellite. The two science teams proposed a dual-band mission, and in 2014 NASA and ISRO agreed to partner on NISAR.

Since then, the agencies have been collaborating across more than 9,000 miles (14,500 kilometers) and 13 time zones. Hardware was built on different continents before being assembled in India to complete the satellite. It’s been a long journey — literally.

More About NISAR

The NISAR mission is an equal collaboration between NASA and ISRO and marks the first time the two agencies have cooperated on hardware development for an Earth-observing mission. Managed for the agency by Caltech, JPL leads the U.S. component of the project and is providing the mission’s L-band SAR. NASA is also providing the radar reflector antenna, the deployable boom, a high-rate communication subsystem for science data, GPS receivers, a solid-state recorder, and payload data subsystem.

Space Applications Centre Ahmedabad, ISRO’s lead center for payload development, is providing the mission’s S-band SAR instrument and is responsible for its calibration, data processing, and development of science algorithms to address the scientific goals of the mission. U R Rao Satellite Centre in Bengaluru, which leads the ISRO components of the mission, is providing the spacecraft bus. The launch vehicle is from ISRO’s Vikram Sarabhai Space Centre, launch services are through ISRO’s Satish Dhawan Space Centre, and satellite mission operations are by ISRO Telemetry Tracking and Command Network. National Remote Sensing Centre in Hyderabad is primarily responsible for S-band data reception, operational products generation, and dissemination.

To learn more about NISAR, visit:

https://nisar.jpl.nasa.gov

News Media Contacts

Andrew Wang / Jane J. Lee
Jet Propulsion Laboratory, Pasadena, Calif.
626-379-6874 / 818-354-0307
andrew.wang@jpl.nasa.gov / jane.j.lee@jpl.nasa.gov

2025-001

❌
❌