Normal view

Before yesterdayMain stream

NASA Tests Drones to Provide Micrometeorology, Aid in Fire Response

13 February 2025 at 16:01
5 Min Read

NASA Tests Drones to Provide Micrometeorology, Aid in Fire Response

Brayden Chamberlain, UAS Pilot in Command, performs pre-flight checks on the NASA Alta X uncrewed aerial system (UAS) during NASA FireSense’s uncrewed aerial system (UAS) technology demonstration in Missoula, Montana.
Pilot in command Brayden Chamberlain performs pre-flight checks on the NASA Alta X quadcopter during the FireSense uncrewed aerial system (UAS) technology demonstration in Missoula.
Credits: NASA ARC/Milan Loiacono

In Aug. 2024, a team of NASA researchers and partners gathered in Missoula, to test new drone-based technology for localized forecasting, or micrometeorology. Researchers attached wind sensors to a drone, NASA’s Alta X quadcopter, aiming to provide precise and sustainable meteorological data to help predict fire behavior.

Wildfires are increasing in number and severity around the world, including the United States, and wind is a major factor. It leads to unexpected and unpredictable fire growth, public threats, and fire fatalities, making micrometeorology a very effective tool to combat fire.

This composite image shows the NASA Alta X quadcopter taking off during one of eight flights it performed for the 2024 FireSense uncrewed aerial system (UAS) technology demonstration in Missoula, Montana. Mounted on top of the drone is a unique infrastructure designed at NASA Langley to carry a radiosonde and an anemometer – two sensors that measure wind speed and direction – into the sky. On the ground, UAS Pilot in Command Brayden Chamberlain performs final pre-flight checks.
This composite image shows the NASA Alta X quadcopter taking off during one of eight flights it performed for the 2024 FireSense UAS technology demonstration in Missoula. Mounted on top of the drone is a unique infrastructure designed at NASA’s Langley Research Center in Hampton,Virginia, to carry sensors that measure wind speed and direction into the sky. On the ground, UAS pilot in command Brayden Chamberlain performs final pre-flight checks.
NASA/Milan Loiacono

The campaign was run by NASA’s FireSense project, focused on addressing challenges in wildland fire management by putting NASA science and technology in the hands of operational agencies.

“Ensuring that the new technology will be easily adoptable by operational agencies such as the U.S. Forest Service and the National Weather Service was another primary goal of the campaign,” said Jacquelyn Shuman, FireSense project scientist at NASA’s Ames Research Center in California’s Silicon Valley.

The FireSense team chose the Alta X drone because the U.S. Forest Service already has a fleet of the quadcopters and trained drone pilots, which could make integrating the needed sensors – and the accompanying infrastructure – much easier and more cost-effective for the agency.

UAS Pilot in Command Brayden Chamberlain flashes a ‘good to go’ signal to the command tent, indicating that the NASA Alta X quadcopter is prepped for takeoff.
The UAS pilot in command, Brayden Chamberlain, flashes a “good to go” signal to the command tent, indicating that the NASA Alta X quadcopter is prepped for takeoff. Behind Chamberlain, the custom structure attached to the quadcopter holds a radiosonde (small white box) and an anemometer (hidden from view), which will collect data on wind speed and direction, humidity, temperature, and pressure.
NASA/Milan Loiacono

The choice of the two sensors for the drone’s payload was also driven by their adoptability.

The first, called a radiosonde, measures wind direction and speed, humidity, temperature, and pressure, and is used daily by the National Weather Service. The other sensor, an anemometer, measures wind speed and direction, and is used at weather stations and airports around the world.

Two images sit side by side. On the left, a small white box with a silver antenna coming out the top and a black antenna coming out the bottom sits in a black structure. On the right, a silver cylinder protrudes from a black base, with two silver, interlocking rings forming a sphere on top. In the back of both photos is a green field.
The two sensors mounted on the NASA Alta X quadcopter are a radiosonde (left) and an anemometer (right), which measure wind speed and direction. The FireSense teams hopes that by giving them wings, researchers can enable micrometeorology to better predict fire and smoke behavior. 
NASA/Milan Loiacono

“Anemometers are everywhere, but are usually stationary,” said Robert McSwain, the FireSense uncrewed aerial system (UAS) lead, based at NASA’s Langley Research Center in Hampton, Virginia. “We are taking a sensor type that is already used all over the world, and giving it wings.”

Anemometers are everywhere, but are usually stationary. We are taking a sensor type that is already used all over the world, and giving it wings.

Robert Mcswain

Robert Mcswain

FireSense Uncrewed Aerial System (UAS) Lead

Both sensors create datasets that are already familiar to meteorologists worldwide, which opens up the potential applications of the platform.

Current Forecasting Methods: Weather Balloons

Traditionally, global weather forecasting data is gathered by attaching a radiosonde to a weather balloon and releasing it into the air. This system works well for regional weather forecasts. But the rapidly changing environment of wildland fire requires more recurrent, pinpointed forecasts to accurately predict fire behavior. It’s the perfect niche for a drone.

Two photos sit side by side. on the left, three male college students work on a large white balloon about three feet in diameter: one is kneeling with a large metal gas canister, the middle student holds the balloon up, and the third student holds a small white instrument attached to the balloon via string. On the right, the same large white balloon drifts into the sky, which is medium blue and mottled with gray clouds.
Left: Steven Stratham (right) attaches a radiosonde to the string of a weather balloon as teammates Travis Christopher (left) and Danny Johnson (center) prepare the balloon for launch. This team of three from Salish Kootenai College is one of many college teams across the nation trained to prepare and launch weather balloons.
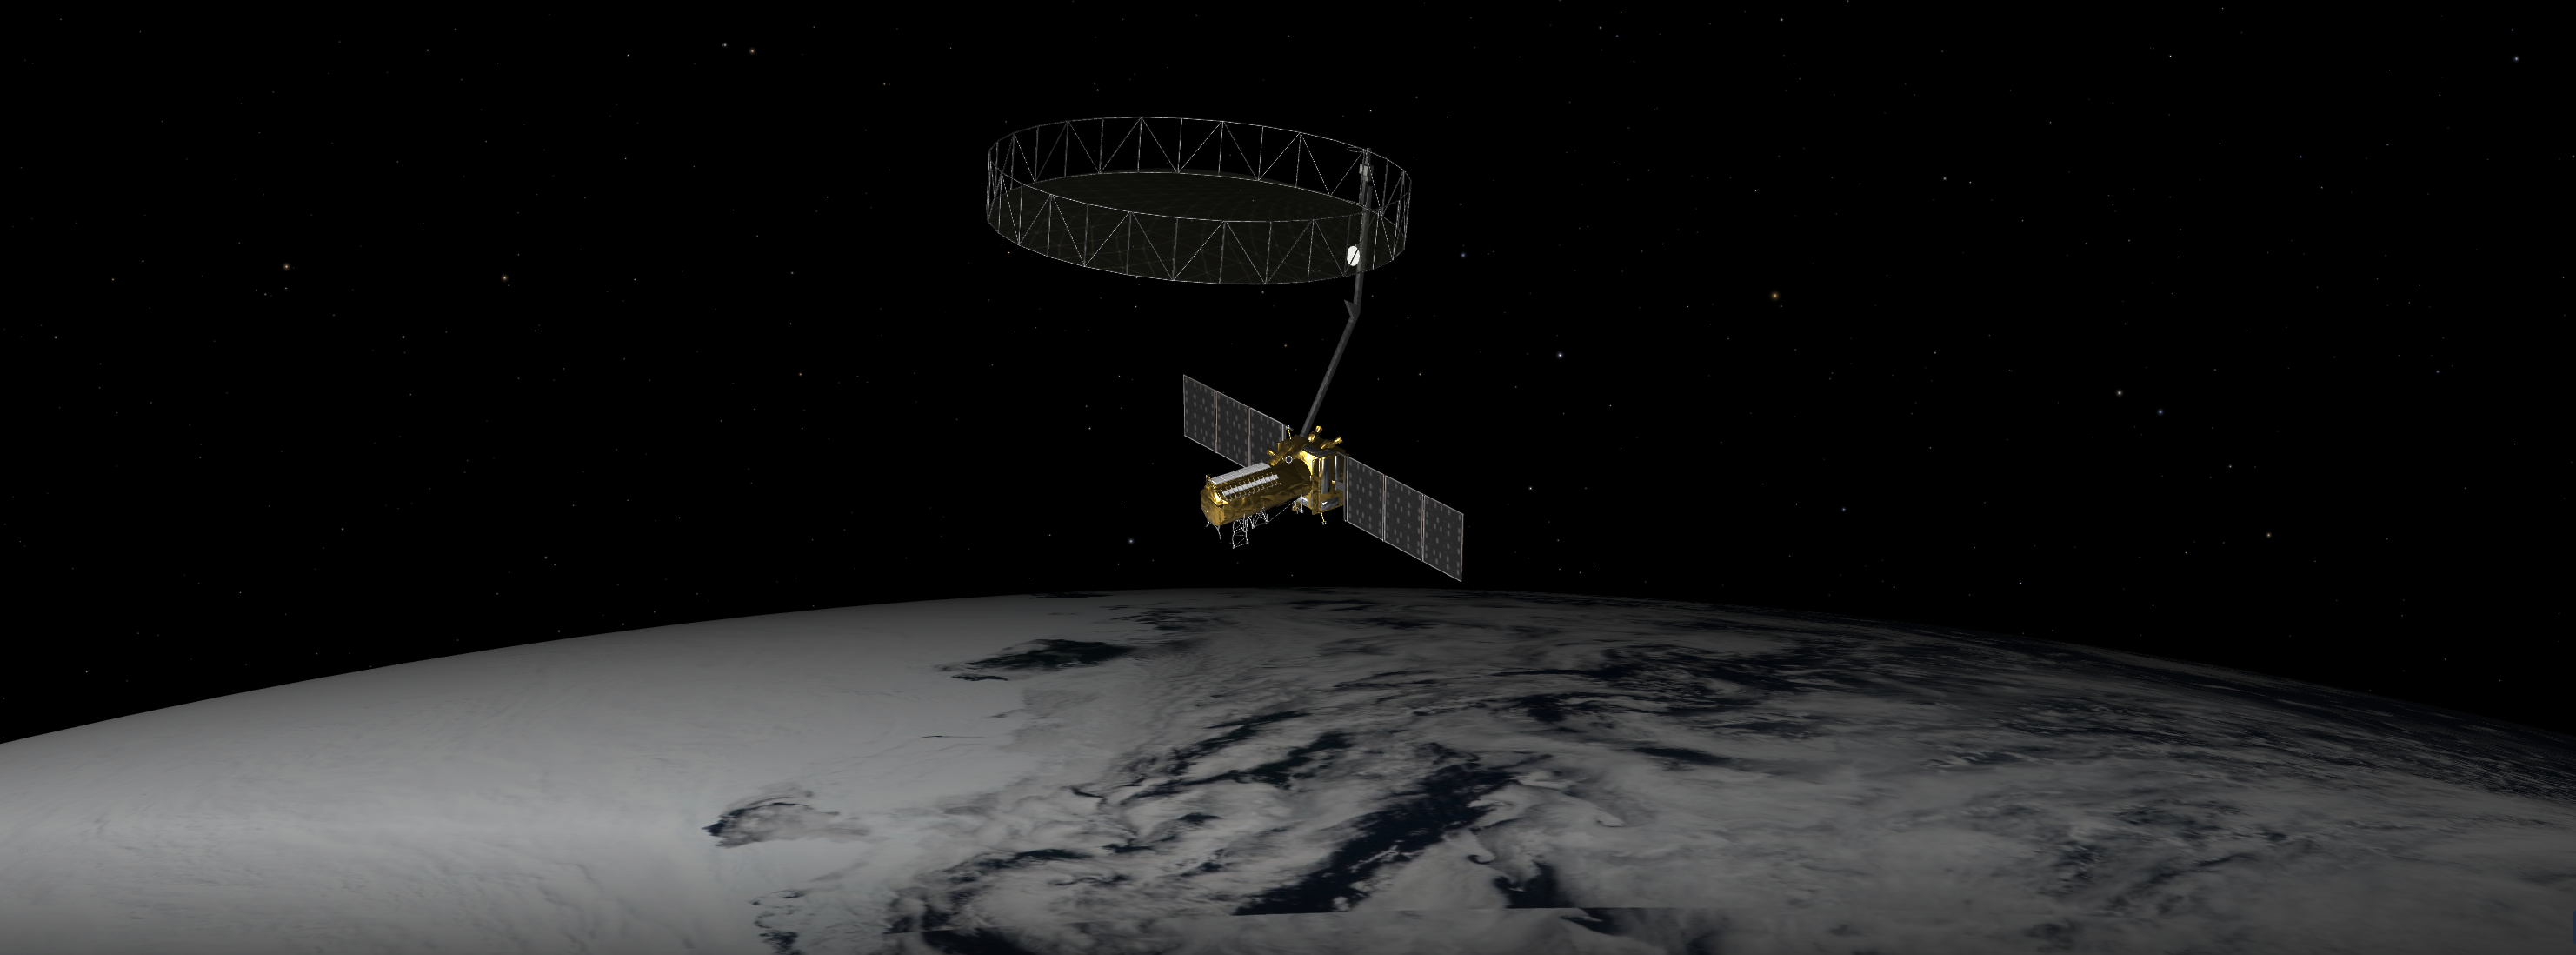
Right: One of these weather balloons lifts into the sky, with the radiosonde visible at the end of the string.
NASA/Milan Loiacono

“These drones are not meant to replace the weather balloons,” said Jennifer Fowler, FireSense’s project manager at Langley. “The goal is to create a drop-in solution to get more frequent, localized data for wildfires – not to replace all weather forecasting.”

The goal is to create a drop-in solution to get more frequent, localized data for wildfires – not to replace all weather forecasting.

Jennifer Fowler

Jennifer Fowler

FireSense Project Manager

Drones Provide Control, Repeat Testing, Sustainability

Drones can be piloted to keep making measurements over a precise location – an on-site forecaster could fly one every couple of hours as conditions change – and gather timely data to help determine how weather will impact the direction and speed of a fire.

Fire crews on the ground may need this information to make quick decisions about where to deploy firefighters and resources, draw fire lines, and protect nearby communities.

A reusable platform, like a drone, also reduces the financial and environmental impact of forecasting flights. 

“A weather balloon is going to be a one-off, and the attached sensor won’t be recovered,” Fowler said. “The instrumented drone, on the other hand, can be flown repeatedly.”

The NASA Alta X quadcopter sits in a field in Missoula, Montana, outfitted with a structure engineered at Langley Research Center to carry a radiosonde and an anemometer into the air. In the background, two deer make their way across the field. The drone and its payload were part of the August 2024 FireSense campaign, which looked at the applicability of using controllable, repeatable airborne measurements to more accurately predict fire and smoke behavior.
The NASA Alta X quadcopter sits in a field in Missoula, outfitted with a special structure to carry a radiosonde (sensor on the left) and an anemometer (sensor on the right) into the air. This structure was engineered at NASA’s Langley Research Center to ensure the sensors are far enough from the rotors to avoid interfering with the data collected, but without compromising the stability of the drone.
NASA/Milan Loiacono

The Missoula Campaign

Before such technology can be sent out to a fire, it needs to be tested. That’s what the FireSense team did this summer.

Smoke from the nearby Miller Peak Fire drifts by the air control tower at Missoula Montana Airport on August 29, 2024. Miller Peak was one of several fires burning in and around Missoula that month, creating a smoke-impacted environment which, combined with the mountainous terrain, makes traditional forecasting methods difficult: a problem the FireSense team is working to solve.
Smoke from the nearby Miller Peak Fire drifts by the air control tower at Missoula Airport on August 29, 2024. Miller Peak was one of several fires burning in and around Missoula that month, creating a smokey environment which, combined with the mountainous terrain, made the area an ideal location to test FireSense’s new micrometeorology technology.
NASA/Milan Loiacono

McSwain described the conditions in Missoula as an “alignment of stars” for the research: the complex mountain terrain produces erratic, historically unpredictable winds, and the sparsity of monitoring instruments on the ground makes weather forecasting very difficult. During the three-day campaign, several fires burned nearby, which allowed researchers to test how the drones performed in smokey conditions.

A drone team out of NASA Langley conducted eight data-collection flights in Missoula. Before each drone flight, student teams from the University of Idaho in Moscow, Idaho, and Salish Kootenai College in Pablo, Montana, launched a weather balloon carrying the same type of radiometer.

Two images sit side by side. On the left, a team of six college students gather around a giant white weather balloon, some standing some sitting. On the ground around them are gear like a tarp, gas lines, and multiple gas canisters. In the photo on the right, two adult men hold a large quadcopter drone sideways between them, rotors akimbo.
Left: Weather balloon teams from University of Idaho and Salish Kootenai College prepare a weather balloon for launch on the second day of the FireSense campaign in Missoula.
Right: NASA Langley drone crew members Todd Ferrante (left) and Brayden Chamberlain (right) calibrate the internal sensors of the NASA Alta X quadcopter before its first test flight on Aug. 27, 2024.

Once those data sets were created, they needed to be transformed into a usable format. Meteorologists are used to the numbers, but incident commanders on an active fire need to see the data in a form that allows them to quickly understand which conditions are changing, and how. That’s where data visualization partners come in. For the Missoula campaign, teams from MITRE, NVIDIA, and Esri joined NASA in the field.

An early data visualization from the Esri team shows the flight path of different weather balloon launches from the first day of the FireSense uncrewed aerial system (UAS) technology demonstration in Missoula, Montana. The paths are color coded by wind speed, from purple (low wind) to bright yellow (high wind).
An early data visualization from the Esri team shows the flight paths of weather balloons launched on the first day of the FireSense UAS technology demonstration in Missoula. The paths are color-coded by wind speed, from purple (low wind) to bright yellow (high wind).
NASA/Milan Loiacono

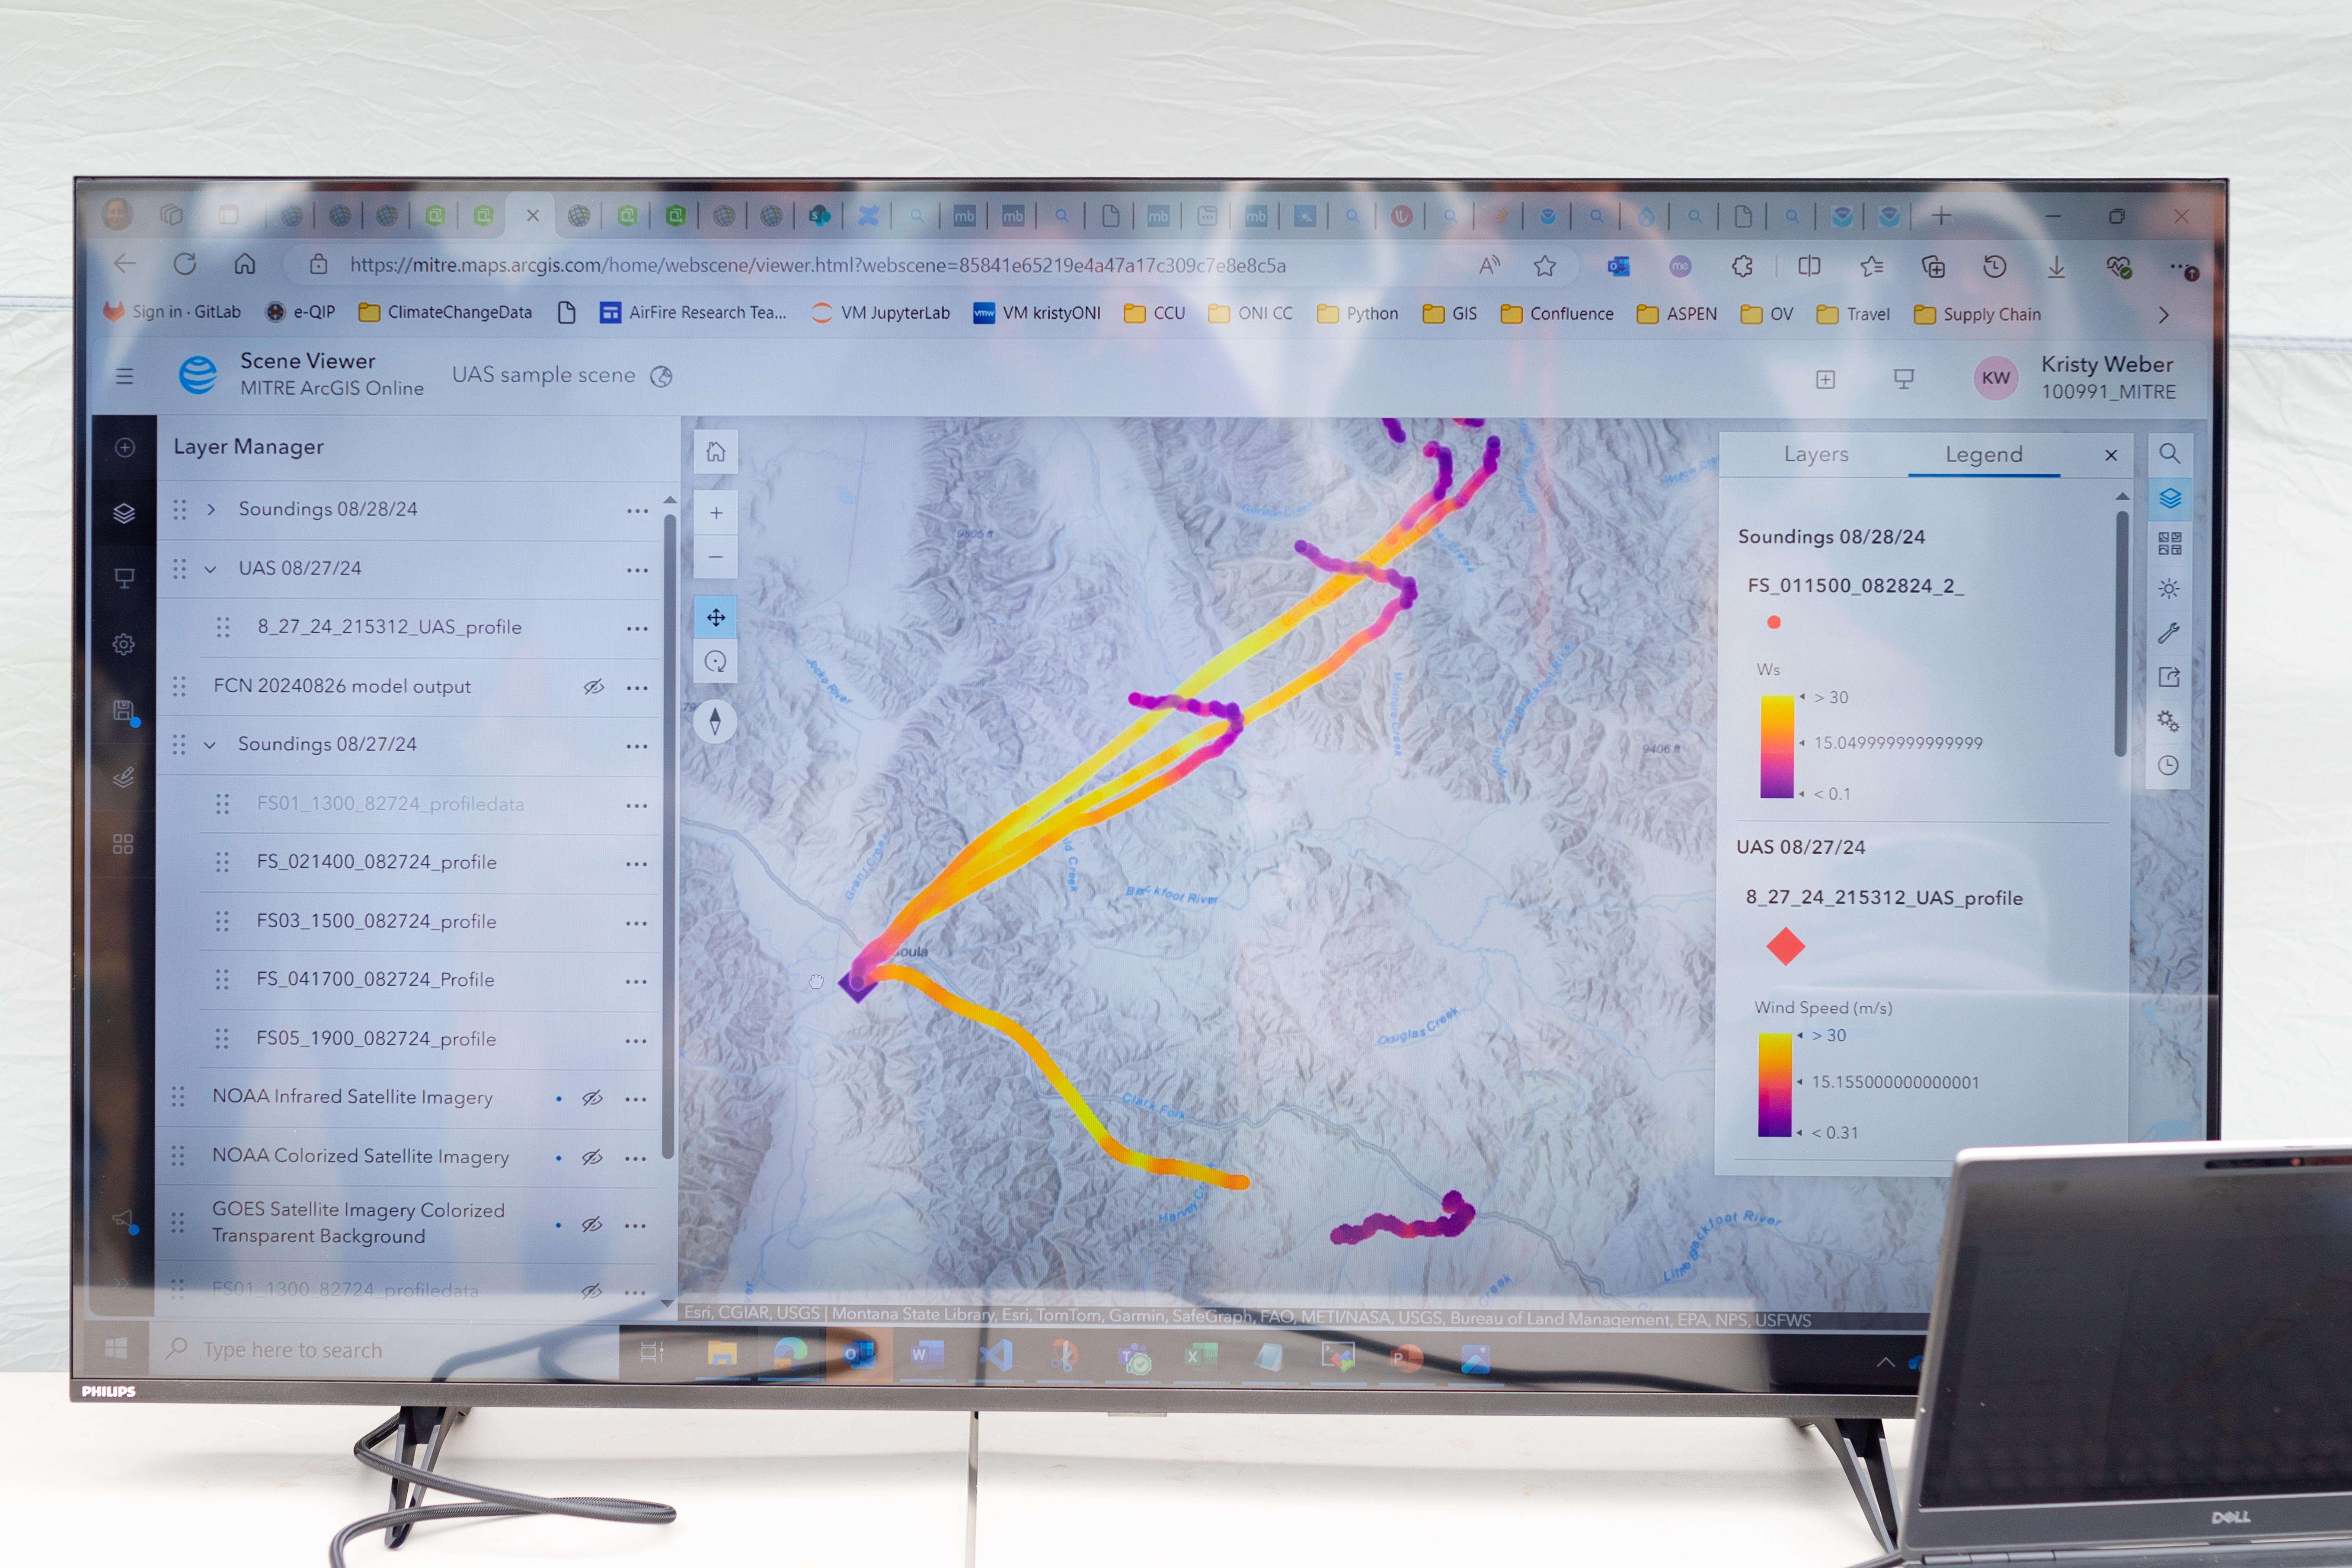
Measurements from both the balloon and the drone platforms were immediately sent to the on-site data teams. The MITRE team, together with NVIDIA, tested high-resolution artificial intelligence meteorological models, while the Esri team created comprehensive visualizations of flight paths, temperatures, and wind speed and direction. These visual representations of the data make conclusions more immediately apparent to non-meteorologists.

What’s Next?

Development of drone capabilities for fire monitoring didn’t begin in Missoula, and it won’t end there.

“This campaign leveraged almost a decade of research, development, engineering, and testing,” said McSwain. “We have built up a UAS flight capability that can now be used across NASA.”

This campaign leveraged almost a decade of research, development, engineering, and testing. We have built up a UAS flight capability that can now be used across NASA.  

Robert Mcswain

Robert Mcswain

FireSense Uncrewed Aerial System (UAS) Lead

The NASA Alta X and its sensor payload will head to Alabama and Florida in spring 2025, incorporating improvements identified in Montana. There, the team will perform another technology demonstration with wildland fire managers from a different region.

To view more photos from the FireSense campaign visit: https://nasa.gov/firesense

The FireSense project is led by NASA Headquarters in Washington and sits within the Wildland Fires program, with the project office based at NASA Ames. The goal of FireSense is to transition Earth science and technological capabilities to operational wildland fire management agencies, to address challenges in U.S. wildland fire management before, during, and after a fire. 

About the Author

Milan Loiacono

Milan Loiacono

Science Communication Specialist

Milan Loiacono is a science communication specialist for the Earth Science Division at NASA Ames Research Center.

Keep Exploring

Discover More Topics From NASA

NASA Radar Imagery Reveals Details About Los Angeles-Area Landslides

31 January 2025 at 12:31
A topographic map of Rancho Palos Verdes, CA (Sept. 18–Oct. 17, 2024) shows landslide velocity in cm/week, with red areas moving fastest (≥10 cm/week). The slide extends beyond the 2007 boundary toward Abalone Cove. An arrow marks the landslide direction southward.
NASA’s UAVSAR airborne radar instrument captured data in fall 2024 showing the motion of landslides on the Palos Verdes Peninsula following record-breaking rainfall in Southern California in 2023 and another heavy-precipitation winter in 2024. Darker red indicates faster motion.
NASA Earth Observatory

Analysis of data from NASA radar aboard an airplane shows that the decades-old active landslide area on the Palos Verdes Peninsula has expanded.

Researchers at NASA’s Jet Propulsion Laboratory in Southern California used data from an airborne radar to measure the movement of the slow-moving landslides on the Palos Verdes Peninsula in Los Angeles County. The analysis determined that, during a four-week period in the fall of 2024, land in the residential area slid toward the ocean by as much as 4 inches (10 centimeters) per week.

Portions of the peninsula, which juts into the Pacific Ocean just south of the city of Los Angeles, are part of an ancient complex of landslides and has been moving for at least the past six decades, affecting hundreds of buildings in local communities. The motion accelerated, and the active area expanded following record-breaking rainfall in Southern California in 2023 and heavy precipitation in early 2024.

To create this visualization, the Advanced Rapid Imaging and Analysis (ARIA) team used data from four flights of NASA’s Uninhabited Aerial Vehicle Synthetic Aperture Radar (UAVSAR) that took place between Sept. 18 and Oct. 17. The UAVSAR instrument was mounted to a Gulfstream III jet flown out of NASA’s Armstrong Flight Research Center in Edwards, California, and the four flights were planned to estimate the speed and direction of the landslides in three dimensions.

In the image above, colors indicate how fast parts of the landslide complex were moving in late September and October, with the darkest reds indicating the highest speeds. The arrows represent the direction of horizontal motion. The white solid lines are the boundaries of the active landslide area as defined in 2007 by the California Geological Survey.

“In effect, we’re seeing that the footprint of land experiencing significant impacts has expanded, and the speed is more than enough to put human life and infrastructure at risk,” said Alexander Handwerger, the JPL landslide scientist who performed the analysis.

The insights from the UAVSAR flights were part of a package of analyses by the ARIA team that also used data from ESA’s (the European Space Agency’s) Copernicus Sentinel-1A/B satellites. The analyses were provided to California officials to support the state’s response to the landslides and made available to the public at NASA’s Disaster Mapping Portal.

Handwerger is also the principal investigator for NASA’s upcoming Landslide Climate Change Experiment, which will use airborne radar to study how extreme wet or dry precipitation patterns influence landslides. The investigation will include flights over coastal slopes spanning the California coastline.

More About ARIA, UAVSAR

The ARIA mission is a collaboration between JPL and Caltech, which manages JPL for NASA, to leverage radar and optical remote-sensing, GPS, and seismic observations for science as well as to aid in disaster response. The project investigates the processes and impacts of earthquakes, volcanoes, landslides, fires, subsurface fluid movement, and other natural hazards.

UAVSAR has flown thousands of radar missions around the world since 2007, studying phenomena such as glaciers and ice sheets, vegetation in ecosystems, and natural hazards like earthquakes, volcanoes, and landslides.

News Media Contacts

Andrew Wang / Jane J. Lee
Jet Propulsion Laboratory, Pasadena, Calif.
626-379-6874 / 818-354-0307
andrew.wang@jpl.nasa.gov / jane.j.lee@jpl.nasa.gov

2025-012

Keep Exploring

Discover More Topics From NASA

How US-Indian NISAR Satellite Will Offer Unique Window on Earth

6 January 2025 at 15:53

5 min read

Preparations for Next Moonwalk Simulations Underway (and Underwater)

artist’s concept depicts the NISAR satellite orbiting Earth over Antarctica
An equal collaboration between NASA and the Indian Space Research Organisation, NISAR will offer unprecedented insights into Earth’s constantly changing land and ice surfaces using synthetic aperture radar technology. The spacecraft, depicted here in an artist’s concept, will launch from India.
NASA/JPL-Caltech

A Q&A with the lead U.S. scientist of the mission, which will track changes in everything from wetlands to ice sheets to infrastructure damaged by natural disasters.

The upcoming U.S.-India NISAR (NASA-ISRO Synthetic Aperture Radar) mission will observe Earth like no mission before, offering insights about our planet’s ever-changing surface.

The NISAR mission is a first-of-a-kind dual-band radar satellite that will measure land deformation from earthquakes, landslides, and volcanoes, producing data for science and disaster response. It will track how much glaciers and ice sheets are advancing or retreating and it will monitor growth and loss of forests and wetlands for insights on the global carbon cycle.

As diverse as NISAR’s impact will be, the mission’s winding path to launch — in a few months’ time — has also been remarkable. Paul Rosen, NISAR’s project scientist at NASA’s Jet Propulsion Laboratory in Southern California, has been there at every step. He recently discussed the mission and what sets it apart.

Paul Rosen
NISAR Project Scientist Paul Rosen of NASA’s Jet Propulsion Laboratory first traveled to India in late 2011 to discuss collaboration with ISRO scientists on an Earth-observing radar mission. NASA and ISRO signed an agreement in 2014 to develop NISAR.
NASA/JPL-Caltech

How will NISAR improve our understanding of Earth?

The planet’s surfaces never stop changing — in some ways small and subtle, and in other ways monumental and sudden. With NISAR, we’ll measure that change roughly every week, with each pixel capturing an area about half the size of a tennis court. Taking imagery of nearly all Earth’s land and ice surfaces this frequently and at such a small scale — down to the centimeter — will help us put the pieces together into one coherent picture to create a story about the planet as a living system.

What sets NISAR apart from other Earth missions?

NISAR will be the first Earth-observing satellite with two kinds of radar — an L-band system with a 10-inch (25-centimeter) wavelength and an S-band system with a 4-inch (10-centimeter) wavelength.

Whether microwaves reflect or penetrate an object depends on their wavelength. Shorter wavelengths are more sensitive to smaller objects such as leaves and rough surfaces, whereas longer wavelengths are more reactive with larger structures like boulders and tree trunks.

So NISAR’s two radar signals will react differently to some features on Earth’s surface. By taking advantage of what each signal is or isn’t sensitive to, researchers can study a broader range of features than they could with either radar on its own, observing the same features with different wavelengths.

Is this new technology?

The concept of a spaceborne synthetic aperture radar, or SAR, studying Earth’s processes dates to the 1970s, when NASA launched Seasat. Though the mission lasted only a few months, it produced first-of-a-kind images that changed the remote-sensing landscape for decades to come.

It also drew me to JPL in 1981 as a college student: I spent two summers analyzing data from the mission. Seasat led to NASA’s Shuttle Imaging Radar program and later to the Shuttle Radar Topography Mission.

What will happen to the data from the mission?

Our data products will fit the needs of users across the mission’s science focus areas — ecosystems, cryosphere, and solid Earth — plus have many uses beyond basic research like soil-moisture and water resources monitoring.

We’ll make the data easily accessible. Given the volume of the data, NASA decided that it would be processed and stored in the cloud, where it’ll be free to access.

How did the ISRO partnership come about?

We proposed DESDynI (Deformation, Ecosystem Structure, and Dynamics of Ice), an L-band satellite, following the 2007 Decadal Survey by the National Academy of Sciences. At the time, ISRO was exploring launching an S-band satellite. The two science teams proposed a dual-band mission, and in 2014 NASA and ISRO agreed to partner on NISAR.

Since then, the agencies have been collaborating across more than 9,000 miles (14,500 kilometers) and 13 time zones. Hardware was built on different continents before being assembled in India to complete the satellite. It’s been a long journey — literally.

More About NISAR

The NISAR mission is an equal collaboration between NASA and ISRO and marks the first time the two agencies have cooperated on hardware development for an Earth-observing mission. Managed for the agency by Caltech, JPL leads the U.S. component of the project and is providing the mission’s L-band SAR. NASA is also providing the radar reflector antenna, the deployable boom, a high-rate communication subsystem for science data, GPS receivers, a solid-state recorder, and payload data subsystem.

Space Applications Centre Ahmedabad, ISRO’s lead center for payload development, is providing the mission’s S-band SAR instrument and is responsible for its calibration, data processing, and development of science algorithms to address the scientific goals of the mission. U R Rao Satellite Centre in Bengaluru, which leads the ISRO components of the mission, is providing the spacecraft bus. The launch vehicle is from ISRO’s Vikram Sarabhai Space Centre, launch services are through ISRO’s Satish Dhawan Space Centre, and satellite mission operations are by ISRO Telemetry Tracking and Command Network. National Remote Sensing Centre in Hyderabad is primarily responsible for S-band data reception, operational products generation, and dissemination.

To learn more about NISAR, visit:

https://nisar.jpl.nasa.gov

News Media Contacts

Andrew Wang / Jane J. Lee
Jet Propulsion Laboratory, Pasadena, Calif.
626-379-6874 / 818-354-0307
andrew.wang@jpl.nasa.gov / jane.j.lee@jpl.nasa.gov

2025-001

❌
❌