Preparations for Next Moonwalk Simulations Underway (and Underwater)
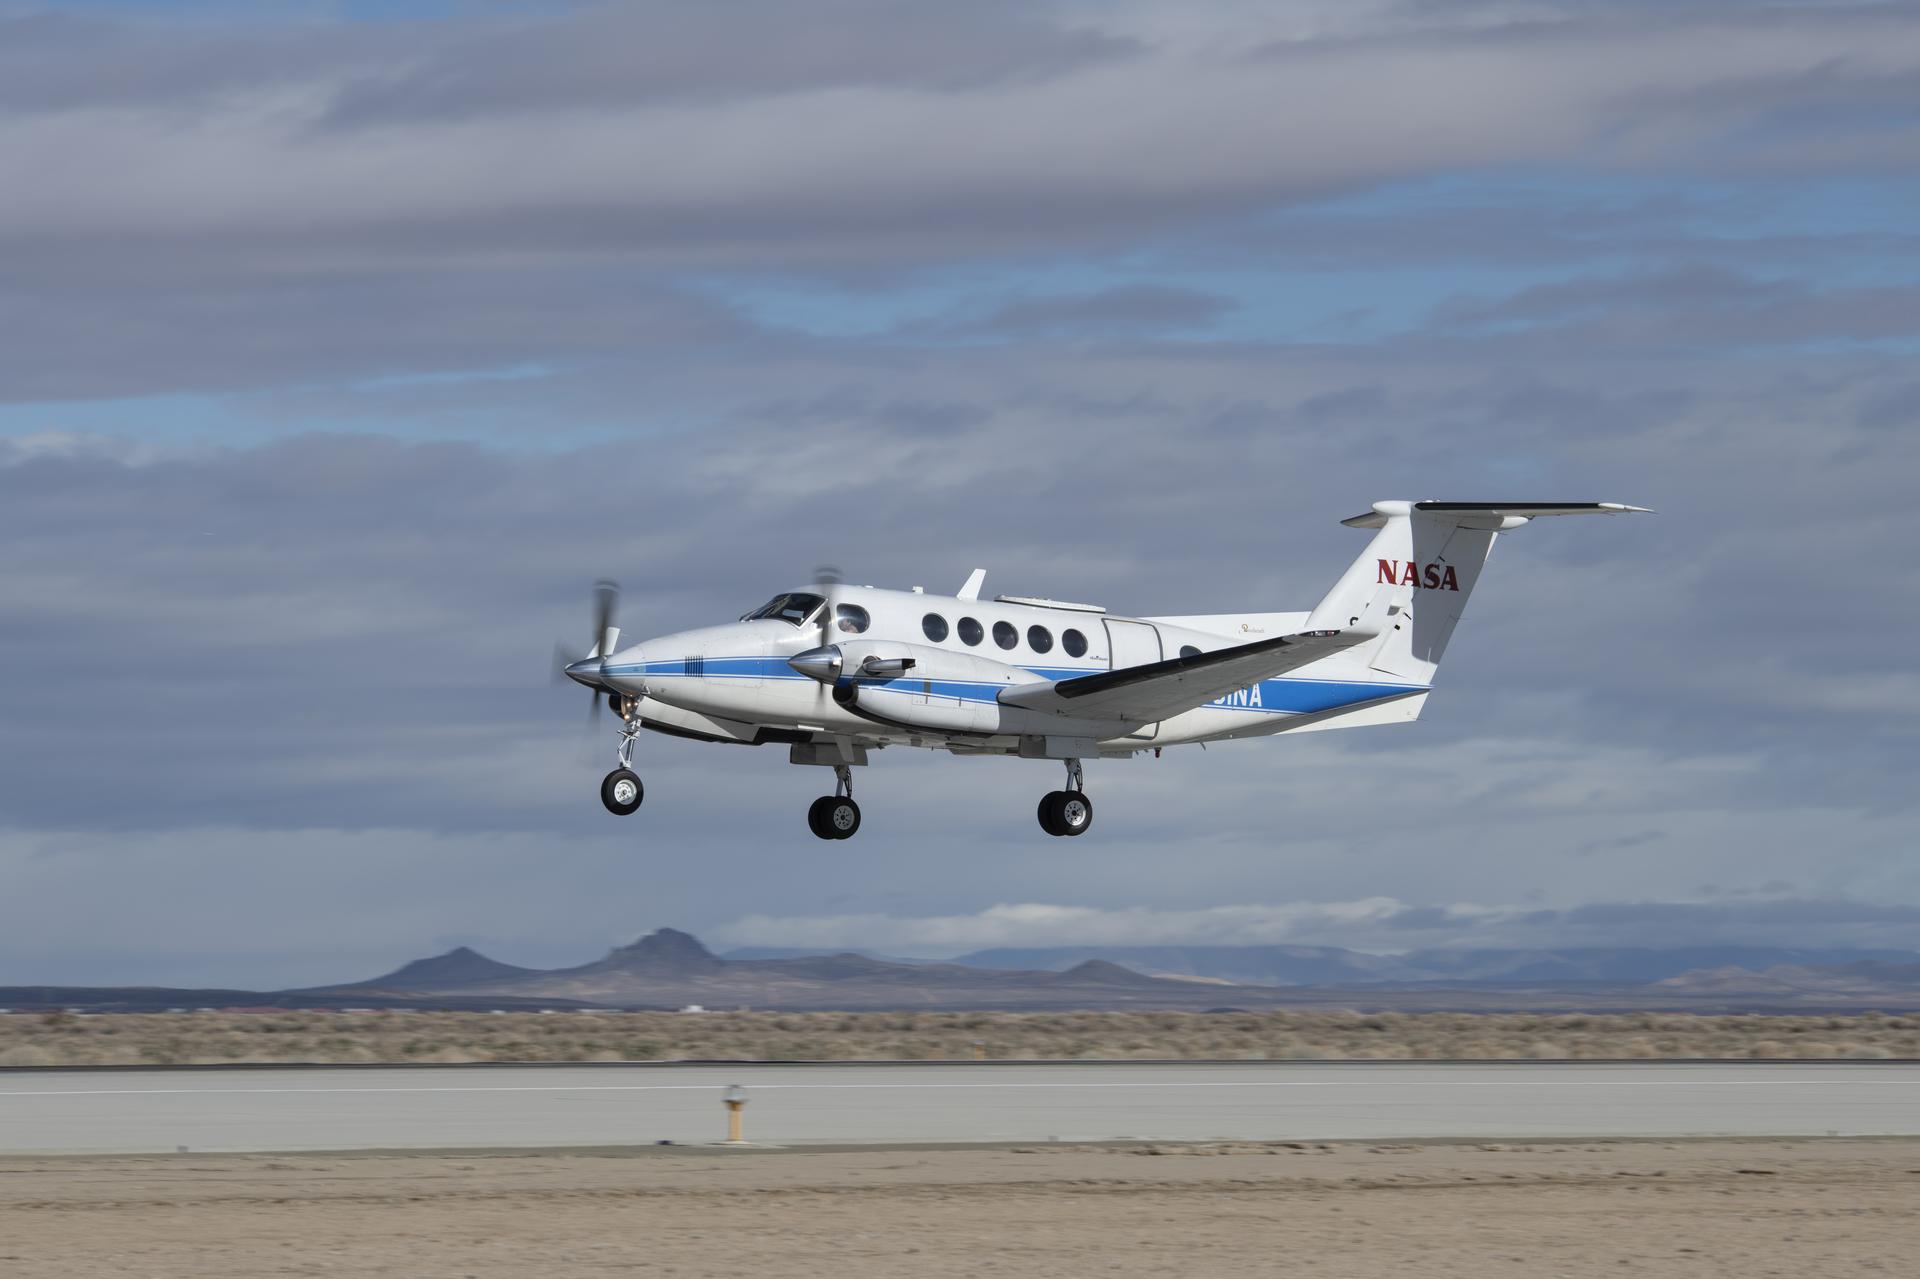
The Compact Fire Infrared Radiance Spectral tracker, or C-FIRST, is managed an operated by NASA’s Jet Propulsion Laboratory, and supported by NASA’s Earth Science Technology Office. Combining state-of-the-art imaging technology with a compact design, C-FIRST enables scientists to gather data about fires and their impacts on ecosystems with greater accuracy and speed than other instruments. C-FIRST was developed as a spaceborne instrument, and flew onboard NASA’s B200 aircraft in January 2025 to conduct an airborne test.
NASA/JPL-Caltech
The January wildfires in California devastated local habitats and communities. In an effort to better understand wildfire behavior, NASA scientists and engineers tried to learn from the events by testing new technology.
The new instrument, the Compact Fire Infrared Radiance Spectral Tracker (c-FIRST), was tested when NASA’s B200 King Air aircraft flew over the wildfires in the Pacific Palisades and Altadena, California. Based at NASA’s Armstrong Flight Research Center in Edwards, California, the aircraft used the c-FIRST instrument to observe the impacts of the fires in near real-time. Due to its small size and ability to efficiently simulate a satellite-based mission, the B200 King Air is uniquely suited for testing c-FIRST.
Managed and operated by NASA’s Jet Propulsion Laboratory in Southern California, c-FIRST gathers thermal infrared images in high-resolution and other data about the terrain to study the impacts of wildfires on ecology. In a single observation, c-FIRST can capture the full temperature range across a wide area of wildland fires – as well as the cool, unburned background – potentially increasing both the quantity and quality of science data produced.
“Currently, no instrument is able to cover the entire range of attributes for fires present in the Earth system,” said Sarath Gunapala, principal investigator for c-FIRST at NASA JPL. “This leads to gaps in our understanding of how many fires occur, and of crucial characteristics like size and temperature.”
For decades, the quality of infrared images has struggled to convey the nuances of high-temperature surfaces above 1,000 degrees Fahrenheit (550 degrees Celsius). Blurry resolution and light saturation of infrared images has inhibited scientists’ understanding of an extremely hot terrain, and thereby also inhibited wildfire research. Historically, images of extremely hot targets often lacked the detail scientists need to understand the range of a fire’s impacts on an ecosystem.
NASA’s Armstrong Flight Research Center in Edwards, California, flew the B200 King Air in support of the Signals of Opportunity Synthetic Aperture Radar (SoOpSAR) campaign on Feb. 27, 2023.
NASA/Steve Freeman
To address this, NASA’s Earth Science Technology Office supported JPL’s development of the c-FIRST instrument, combining state-of-the-art imaging technology with a compact and efficient design. When c-FIRST was airborne, scientists could detect smoldering fires more accurately and quickly, while also gathering important information on active fires in near real-time.
“These smoldering fires can flame up if the wind picks up again,” said Gunapala. “Therefore, the c-FIRST data set could provide very important information for firefighting agencies to fight fires more effectively.”
For instance, c-FIRST data can help scientists estimate the likelihood of a fire spreading in a certain landscape, allowing officials to more effectively monitor smoldering fires and track how fires evolve. Furthermore, c-FIRST can collect detailed data that can enable scientists to understand how an ecosystem may recover from fire events.
“The requirements of the c-FIRST instrument meet the flight profile of the King Air,” said KC Sujan, operations engineer for the B200 King Air. “The c-FIRST team wanted a quick integration, the flight speed in the range 130 and 140 knots on a level flight, communication and navigation systems, and the instruments power requirement that are perfectly fit for King Air’s capability.”
By first testing the instrument onboard the B200 King Air, the c-FIRST team can evaluate its readiness for future satellite missions investigating wildfires. On a changing planet where wildfires are increasingly common, instruments like c-FIRST could provide data that can aid firefighting agencies to fight fires more effectively, and to understand the ecosystemic impacts of extreme weather events.
NASA Tests Drones to Provide Micrometeorology, Aid in Fire Response
Pilot in command Brayden Chamberlain performs pre-flight checks on the NASA Alta X quadcopter during the FireSense uncrewed aerial system (UAS) technology demonstration in Missoula.
Credits: NASA ARC/Milan Loiacono
In Aug. 2024, a team of NASA researchers and partners gathered in Missoula, Montana to test new drone-based technology for localized forecasting, or micrometeorology. Researchers attached wind sensors to a drone, NASA’s Alta X quadcopter, aiming to provide precise and sustainable meteorological data to help predict fire behavior.
Wildfires are increasing in number and severity around the world, including the United States, and wind is a major factor. It leads to unexpected and unpredictable fire growth, public threats, and fire fatalities, making micrometeorology a very effective tool to combat fire.
This composite image shows the NASA Alta X quadcopter taking off during one of eight flights it performed for the 2024 FireSense UAS technology demonstration in Missoula. Mounted on top of the drone is a unique infrastructure designed at NASA’s Langley Research Center in Hampton,Virginia, to carry sensors that measure wind speed and direction into the sky. On the ground, UAS pilot in command Brayden Chamberlain performs final pre-flight checks.
NASA/Milan Loiacono
The campaign was run by NASA’s FireSense project, focused on addressing challenges in wildland fire management by putting NASA science and technology in the hands of operational agencies.
“Ensuring that the new technology will be easily adoptable by operational agencies such as the U.S. Forest Service and the National Weather Service was another primary goal of the campaign,” said Jacquelyn Shuman, FireSense project scientist at NASA’s Ames Research Center in California’s Silicon Valley.
The FireSense team chose the Alta X drone because the U.S. Forest Service already has a fleet of the quadcopters and trained drone pilots, which could make integrating the needed sensors – and the accompanying infrastructure – much easier and more cost-effective for the agency.
The UAS pilot in command, Brayden Chamberlain, flashes a “good to go” signal to the command tent, indicating that the NASA Alta X quadcopter is prepped for takeoff. Behind Chamberlain, the custom structure attached to the quadcopter holds a radiosonde (small white box) and an anemometer (hidden from view), which will collect data on wind speed and direction, humidity, temperature, and pressure.
NASA/Milan Loiacono
The choice of the two sensors for the drone’s payload was also driven by their adoptability.
The first, called a radiosonde, measures wind direction and speed, humidity, temperature, and pressure, and is used daily by the National Weather Service. The other sensor, an anemometer, measures wind speed and direction, and is used at weather stations and airports around the world.
The two sensors mounted on the NASA Alta X quadcopter are a radiosonde (left) and an anemometer (right), which measure wind speed and direction. The FireSense teams hopes that by giving them wings, researchers can enable micrometeorology to better predict fire and smoke behavior.
NASA/Milan Loiacono
“Anemometers are everywhere, but are usually stationary,” said Robert McSwain, the FireSense uncrewed aerial system (UAS) lead, based at NASA’s Langley Research Center in Hampton, Virginia. “We are taking a sensor type that is already used all over the world, and giving it wings.”
Anemometers are everywhere, but are usually stationary. We are taking a sensor type that is already used all over the world, and giving it wings.
Robert Mcswain
FireSense Uncrewed Aerial System (UAS) Lead
Both sensors create datasets that are already familiar to meteorologists worldwide, which opens up the potential applications of the platform.
Current Forecasting Methods: Weather Balloons
Traditionally, global weather forecasting data is gathered by attaching a radiosonde to a weather balloon and releasing it into the air. This system works well for regional weather forecasts. But the rapidly changing environment of wildland fire requires more recurrent, pinpointed forecasts to accurately predict fire behavior. It’s the perfect niche for a drone.
Left: Steven Stratham (right) attaches a radiosonde to the string of a weather balloon as teammates Travis Christopher (left) and Danny Johnson (center) prepare the balloon for launch. This team of three from Salish Kootenai College is one of many college teams across the nation trained to prepare and launch weather balloons. Right: One of these weather balloons lifts into the sky, with the radiosonde visible at the end of the string.
NASA/Milan Loiacono
“These drones are not meant to replace the weather balloons,” said Jennifer Fowler, FireSense’s project manager at Langley. “The goal is to create a drop-in solution to get more frequent, localized data for wildfires – not to replace all weather forecasting.”
The goal is to create a drop-in solution to get more frequent, localized data for wildfires – not to replace all weather forecasting.
Jennifer Fowler
FireSense Project Manager
Drones Provide Control, Repeat Testing, Sustainability
Drones can be piloted to keep making measurements over a precise location – an on-site forecaster could fly one every couple of hours as conditions change – and gather timely data to help determine how weather will impact the direction and speed of a fire.
Fire crews on the ground may need this information to make quick decisions about where to deploy firefighters and resources, draw fire lines, and protect nearby communities.
A reusable platform, like a drone, also reduces the financial and environmental impact of forecasting flights.
“A weather balloon is going to be a one-off, and the attached sensor won’t be recovered,” Fowler said. “The instrumented drone, on the other hand, can be flown repeatedly.”
The NASA Alta X quadcopter sits in a field in Missoula, outfitted with a special structure to carry a radiosonde (sensor on the left) and an anemometer (sensor on the right) into the air. This structure was engineered at NASA’s Langley Research Center to ensure the sensors are far enough from the rotors to avoid interfering with the data collected, but without compromising the stability of the drone.
NASA/Milan Loiacono
The Missoula Campaign
Before such technology can be sent out to a fire, it needs to be tested. That’s what the FireSense team did this summer.
Smoke from the nearby Miller Peak Fire drifts by the air control tower at Missoula Airport on August 29, 2024. Miller Peak was one of several fires burning in and around Missoula that month, creating a smokey environment which, combined with the mountainous terrain, made the area an ideal location to test FireSense’s new micrometeorology technology.
NASA/Milan Loiacono
McSwain described the conditions in Missoula as an “alignment of stars” for the research: the complex mountain terrain produces erratic, historically unpredictable winds, and the sparsity of monitoring instruments on the ground makes weather forecasting very difficult. During the three-day campaign, several fires burned nearby, which allowed researchers to test how the drones performed in smokey conditions.
A drone team out of NASA Langley conducted eight data-collection flights in Missoula. Before each drone flight, student teams from the University of Idaho in Moscow, Idaho, and Salish Kootenai College in Pablo, Montana, launched a weather balloon carrying the same type of radiometer.
Left: Weather balloon teams from University of Idaho and Salish Kootenai College prepare a weather balloon for launch on the second day of the FireSense campaign in Missoula. Right: NASA Langley drone crew members Todd Ferrante (left) and Brayden Chamberlain (right) calibrate the internal sensors of the NASA Alta X quadcopter before its first test flight on Aug. 27, 2024.
Once those data sets were created, they needed to be transformed into a usable format. Meteorologists are used to the numbers, but incident commanders on an active fire need to see the data in a form that allows them to quickly understand which conditions are changing, and how. That’s where data visualization partners come in. For the Missoula campaign, teams from MITRE, NVIDIA, and Esri joined NASA in the field.
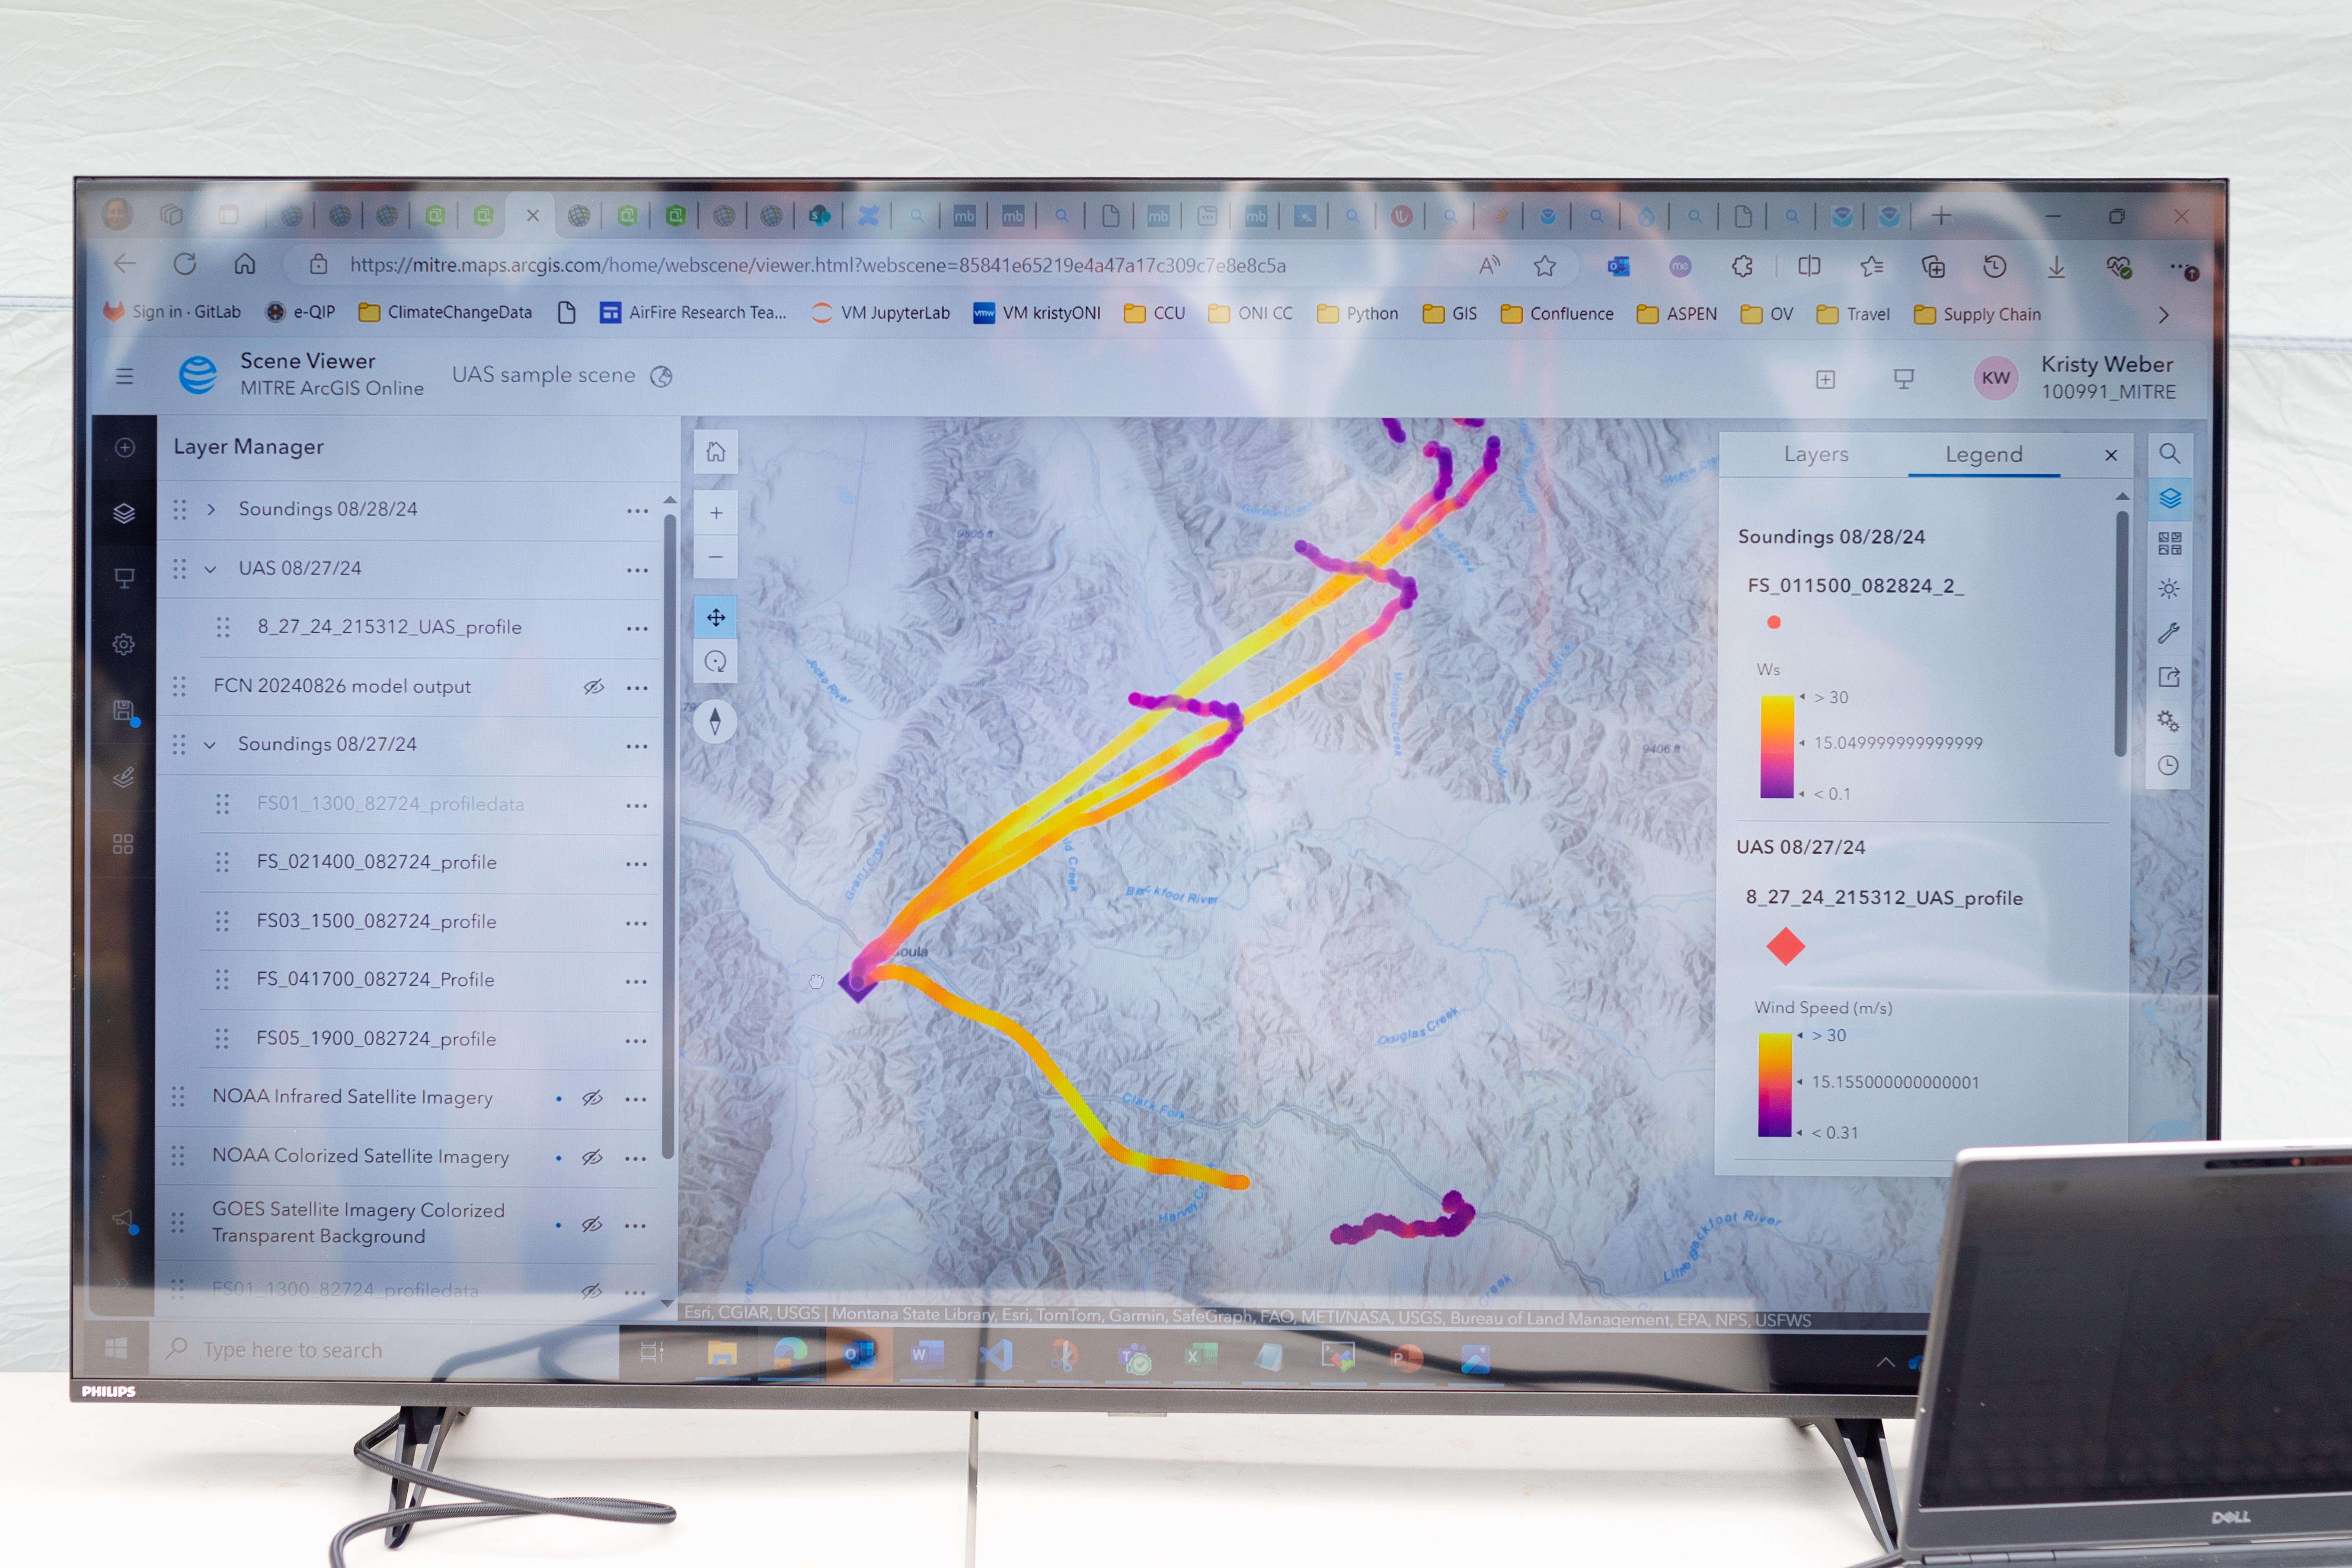
An early data visualization from the Esri team shows the flight paths of weather balloons launched on the first day of the FireSense UAS technology demonstration in Missoula. The paths are color-coded by wind speed, from purple (low wind) to bright yellow (high wind).
NASA/Milan Loiacono
Measurements from both the balloon and the drone platforms were immediately sent to the on-site data teams. The MITRE team, together with NVIDIA, tested high-resolution artificial intelligence meteorological models, while the Esri team created comprehensive visualizations of flight paths, temperatures, and wind speed and direction. These visual representations of the data make conclusions more immediately apparent to non-meteorologists.
What’s Next?
Development of drone capabilities for fire monitoring didn’t begin in Missoula, and it won’t end there.
“This campaign leveraged almost a decade of research, development, engineering, and testing,” said McSwain. “We have built up a UAS flight capability that can now be used across NASA.”
This campaign leveraged almost a decade of research, development, engineering, and testing. We have built up a UAS flight capability that can now be used across NASA.
Robert Mcswain
FireSense Uncrewed Aerial System (UAS) Lead
The NASA Alta X and its sensor payload will head to Alabama and Florida in spring 2025, incorporating improvements identified in Montana. There, the team will perform another technology demonstration with wildland fire managers from a different region.
The FireSense project is led by NASA Headquarters in Washington and sits within the Wildland Fires program, with the project office based at NASA Ames. The goal of FireSense is to transition Earth science and technological capabilities to operational wildland fire management agencies, to address challenges in U.S. wildland fire management before, during, and after a fire.
About the Author
Milan Loiacono
Science Communication Specialist
Milan Loiacono is a science communication specialist for the Earth Science Division at NASA Ames Research Center.
NASA Tests Drones to Provide Micrometeorology, Aid in Fire Response
Pilot in command Brayden Chamberlain performs pre-flight checks on the NASA Alta X quadcopter during the FireSense uncrewed aerial system (UAS) technology demonstration in Missoula.
Credits: NASA ARC/Milan Loiacono
In Aug. 2024, a team of NASA researchers and partners gathered in Missoula, to test new drone-based technology for localized forecasting, or micrometeorology. Researchers attached wind sensors to a drone, NASA’s Alta X quadcopter, aiming to provide precise and sustainable meteorological data to help predict fire behavior.
Wildfires are increasing in number and severity around the world, including the United States, and wind is a major factor. It leads to unexpected and unpredictable fire growth, public threats, and fire fatalities, making micrometeorology a very effective tool to combat fire.
This composite image shows the NASA Alta X quadcopter taking off during one of eight flights it performed for the 2024 FireSense UAS technology demonstration in Missoula. Mounted on top of the drone is a unique infrastructure designed at NASA’s Langley Research Center in Hampton,Virginia, to carry sensors that measure wind speed and direction into the sky. On the ground, UAS pilot in command Brayden Chamberlain performs final pre-flight checks.
NASA/Milan Loiacono
The campaign was run by NASA’s FireSense project, focused on addressing challenges in wildland fire management by putting NASA science and technology in the hands of operational agencies.
“Ensuring that the new technology will be easily adoptable by operational agencies such as the U.S. Forest Service and the National Weather Service was another primary goal of the campaign,” said Jacquelyn Shuman, FireSense project scientist at NASA’s Ames Research Center in California’s Silicon Valley.
The FireSense team chose the Alta X drone because the U.S. Forest Service already has a fleet of the quadcopters and trained drone pilots, which could make integrating the needed sensors – and the accompanying infrastructure – much easier and more cost-effective for the agency.
The UAS pilot in command, Brayden Chamberlain, flashes a “good to go” signal to the command tent, indicating that the NASA Alta X quadcopter is prepped for takeoff. Behind Chamberlain, the custom structure attached to the quadcopter holds a radiosonde (small white box) and an anemometer (hidden from view), which will collect data on wind speed and direction, humidity, temperature, and pressure.
NASA/Milan Loiacono
The choice of the two sensors for the drone’s payload was also driven by their adoptability.
The first, called a radiosonde, measures wind direction and speed, humidity, temperature, and pressure, and is used daily by the National Weather Service. The other sensor, an anemometer, measures wind speed and direction, and is used at weather stations and airports around the world.
The two sensors mounted on the NASA Alta X quadcopter are a radiosonde (left) and an anemometer (right), which measure wind speed and direction. The FireSense teams hopes that by giving them wings, researchers can enable micrometeorology to better predict fire and smoke behavior.
NASA/Milan Loiacono
“Anemometers are everywhere, but are usually stationary,” said Robert McSwain, the FireSense uncrewed aerial system (UAS) lead, based at NASA’s Langley Research Center in Hampton, Virginia. “We are taking a sensor type that is already used all over the world, and giving it wings.”
Anemometers are everywhere, but are usually stationary. We are taking a sensor type that is already used all over the world, and giving it wings.
Robert Mcswain
FireSense Uncrewed Aerial System (UAS) Lead
Both sensors create datasets that are already familiar to meteorologists worldwide, which opens up the potential applications of the platform.
Current Forecasting Methods: Weather Balloons
Traditionally, global weather forecasting data is gathered by attaching a radiosonde to a weather balloon and releasing it into the air. This system works well for regional weather forecasts. But the rapidly changing environment of wildland fire requires more recurrent, pinpointed forecasts to accurately predict fire behavior. It’s the perfect niche for a drone.
Left: Steven Stratham (right) attaches a radiosonde to the string of a weather balloon as teammates Travis Christopher (left) and Danny Johnson (center) prepare the balloon for launch. This team of three from Salish Kootenai College is one of many college teams across the nation trained to prepare and launch weather balloons. Right: One of these weather balloons lifts into the sky, with the radiosonde visible at the end of the string.
NASA/Milan Loiacono
“These drones are not meant to replace the weather balloons,” said Jennifer Fowler, FireSense’s project manager at Langley. “The goal is to create a drop-in solution to get more frequent, localized data for wildfires – not to replace all weather forecasting.”
The goal is to create a drop-in solution to get more frequent, localized data for wildfires – not to replace all weather forecasting.
Jennifer Fowler
FireSense Project Manager
Drones Provide Control, Repeat Testing, Sustainability
Drones can be piloted to keep making measurements over a precise location – an on-site forecaster could fly one every couple of hours as conditions change – and gather timely data to help determine how weather will impact the direction and speed of a fire.
Fire crews on the ground may need this information to make quick decisions about where to deploy firefighters and resources, draw fire lines, and protect nearby communities.
A reusable platform, like a drone, also reduces the financial and environmental impact of forecasting flights.
“A weather balloon is going to be a one-off, and the attached sensor won’t be recovered,” Fowler said. “The instrumented drone, on the other hand, can be flown repeatedly.”
The NASA Alta X quadcopter sits in a field in Missoula, outfitted with a special structure to carry a radiosonde (sensor on the left) and an anemometer (sensor on the right) into the air. This structure was engineered at NASA’s Langley Research Center to ensure the sensors are far enough from the rotors to avoid interfering with the data collected, but without compromising the stability of the drone.
NASA/Milan Loiacono
The Missoula Campaign
Before such technology can be sent out to a fire, it needs to be tested. That’s what the FireSense team did this summer.
Smoke from the nearby Miller Peak Fire drifts by the air control tower at Missoula Airport on August 29, 2024. Miller Peak was one of several fires burning in and around Missoula that month, creating a smokey environment which, combined with the mountainous terrain, made the area an ideal location to test FireSense’s new micrometeorology technology.
NASA/Milan Loiacono
McSwain described the conditions in Missoula as an “alignment of stars” for the research: the complex mountain terrain produces erratic, historically unpredictable winds, and the sparsity of monitoring instruments on the ground makes weather forecasting very difficult. During the three-day campaign, several fires burned nearby, which allowed researchers to test how the drones performed in smokey conditions.
A drone team out of NASA Langley conducted eight data-collection flights in Missoula. Before each drone flight, student teams from the University of Idaho in Moscow, Idaho, and Salish Kootenai College in Pablo, Montana, launched a weather balloon carrying the same type of radiometer.
Left: Weather balloon teams from University of Idaho and Salish Kootenai College prepare a weather balloon for launch on the second day of the FireSense campaign in Missoula. Right: NASA Langley drone crew members Todd Ferrante (left) and Brayden Chamberlain (right) calibrate the internal sensors of the NASA Alta X quadcopter before its first test flight on Aug. 27, 2024.
Once those data sets were created, they needed to be transformed into a usable format. Meteorologists are used to the numbers, but incident commanders on an active fire need to see the data in a form that allows them to quickly understand which conditions are changing, and how. That’s where data visualization partners come in. For the Missoula campaign, teams from MITRE, NVIDIA, and Esri joined NASA in the field.
An early data visualization from the Esri team shows the flight paths of weather balloons launched on the first day of the FireSense UAS technology demonstration in Missoula. The paths are color-coded by wind speed, from purple (low wind) to bright yellow (high wind).
NASA/Milan Loiacono
Measurements from both the balloon and the drone platforms were immediately sent to the on-site data teams. The MITRE team, together with NVIDIA, tested high-resolution artificial intelligence meteorological models, while the Esri team created comprehensive visualizations of flight paths, temperatures, and wind speed and direction. These visual representations of the data make conclusions more immediately apparent to non-meteorologists.
What’s Next?
Development of drone capabilities for fire monitoring didn’t begin in Missoula, and it won’t end there.
“This campaign leveraged almost a decade of research, development, engineering, and testing,” said McSwain. “We have built up a UAS flight capability that can now be used across NASA.”
This campaign leveraged almost a decade of research, development, engineering, and testing. We have built up a UAS flight capability that can now be used across NASA.
Robert Mcswain
FireSense Uncrewed Aerial System (UAS) Lead
The NASA Alta X and its sensor payload will head to Alabama and Florida in spring 2025, incorporating improvements identified in Montana. There, the team will perform another technology demonstration with wildland fire managers from a different region.
The FireSense project is led by NASA Headquarters in Washington and sits within the Wildland Fires program, with the project office based at NASA Ames. The goal of FireSense is to transition Earth science and technological capabilities to operational wildland fire management agencies, to address challenges in U.S. wildland fire management before, during, and after a fire.
About the Author
Milan Loiacono
Science Communication Specialist
Milan Loiacono is a science communication specialist for the Earth Science Division at NASA Ames Research Center.
Preparations for Next Moonwalk Simulations Underway (and Underwater)
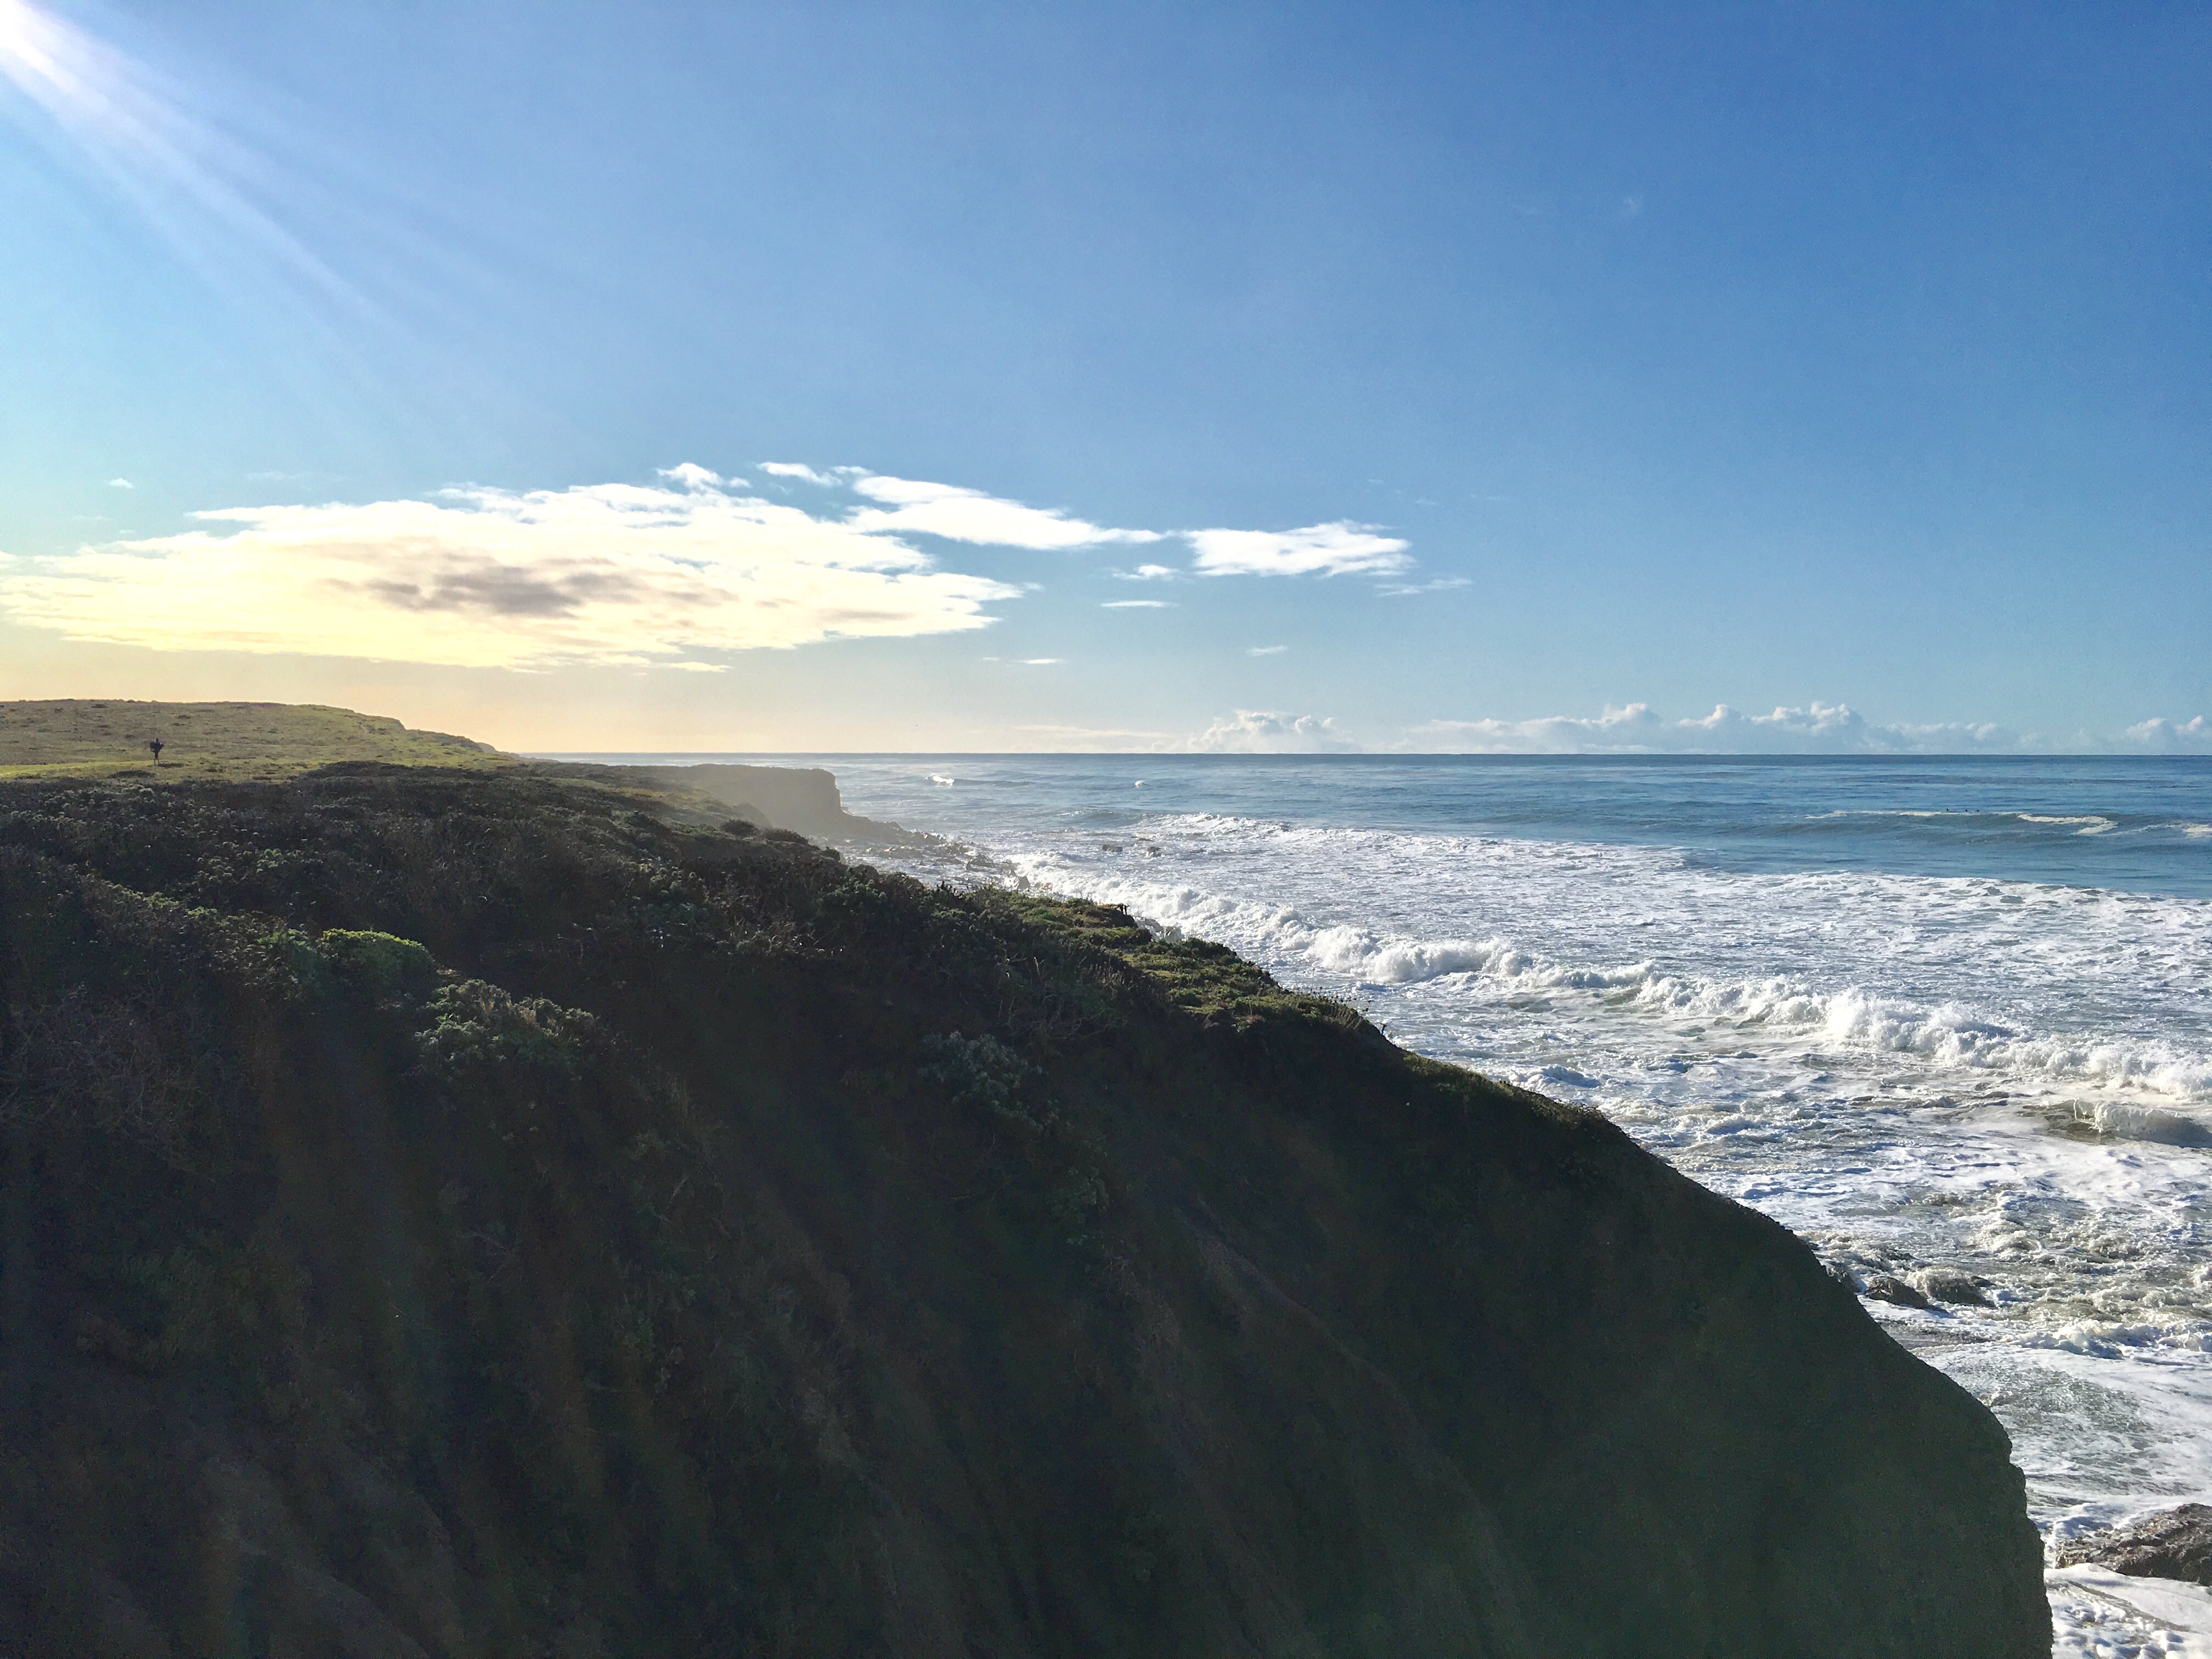
Cliffs slope into the ocean in San Simeon, California. All along the state’s dynamic coastline, land is inching down and up due to natural and human-caused factors. A better understanding of this motion can help communities prepare for rising seas.
NASA/JPL-Caltech
The elevation changes may seem small — amounting to fractions of inches per year — but they can increase or decrease local flood risk, wave exposure, and saltwater intrusion.
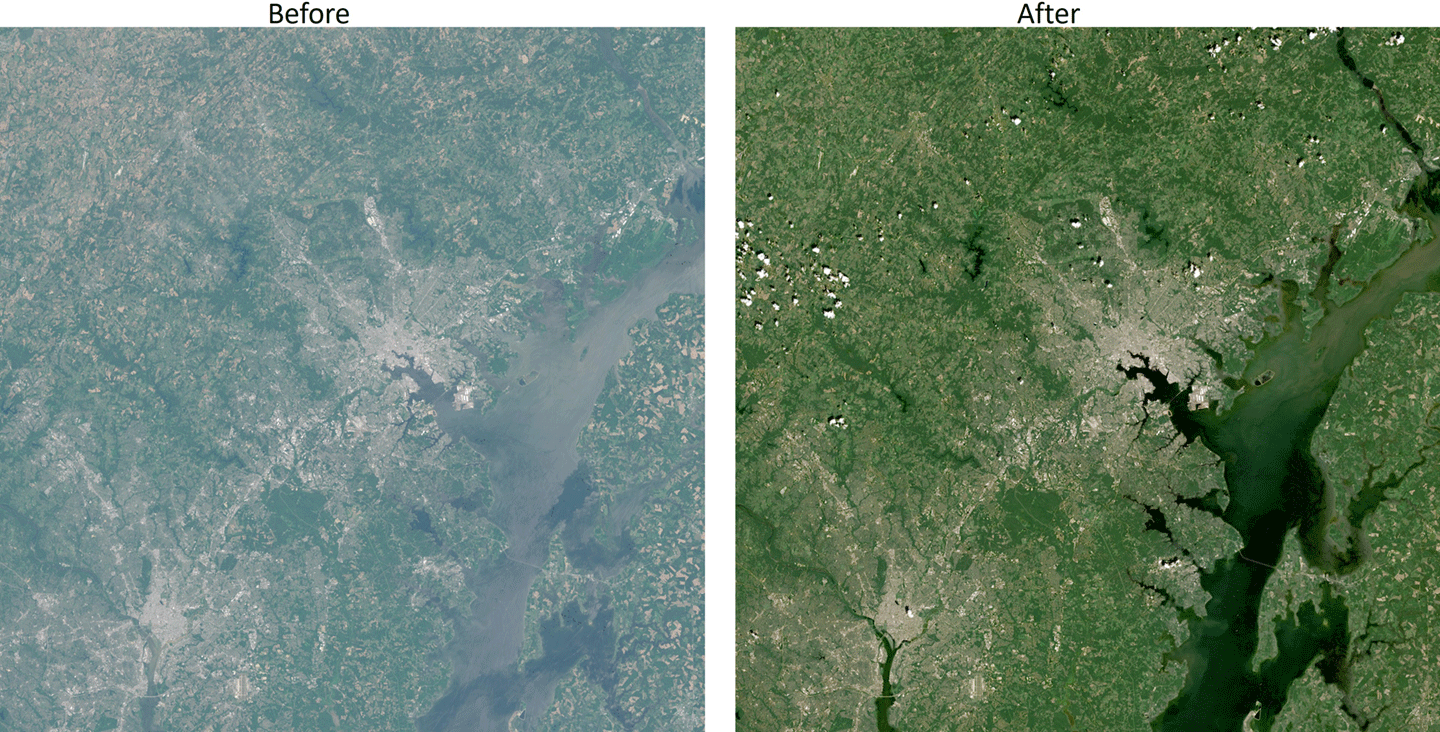
Tracking and predicting sea level rise involves more than measuring the height of our oceans: Land along coastlines also inches up and down in elevation. Using California as a case study, a NASA-led team has shown how seemingly modest vertical land motion could significantly impact local sea levels in coming decades.
By 2050, sea levels in California are expected to increase between 6 and 14.5 inches (15 and 37 centimeters) higher than year 2000 levels. Melting glaciers and ice sheets, as well as warming ocean water, are primarily driving the rise. As coastal communities develop adaptation strategies, they can also benefit from a better understanding of the land’s role, the team said. The findings are being used in updated guidance for the state.
“In many parts of the world, like the reclaimed ground beneath San Francisco, the land is moving down faster than the sea itself is going up,” said lead author Marin Govorcin, a remote sensing scientist at NASA’s Jet Propulsion Laboratory in Southern California.
The new study illustrates how vertical land motion can be unpredictable in scale and speed; it results from both human-caused factors such as groundwater pumping and wastewater injection, as well as from natural ones like tectonic activity. The researchers showed how direct satellite observations can improve estimates of vertical land motion and relative sea level rise. Current models, which are based on tide gauge measurements, cannot cover every location and all the dynamic land motion at work within a given region.
Local Changes
Researchers from JPL and the National Oceanic and Atmospheric Administration (NOAA) used satellite radar to track more than a thousand miles of California coast rising and sinking in new detail. They pinpointed hot spots — including cities, beaches, and aquifers — at greater exposure to rising seas now and in coming decades.
To capture localized motion inch by inch from space, the team analyzed radar measurements made by ESA’s (the European Space Agency’s) Sentinel-1 satellites, as well as motion velocity data from ground-based receiving stations in the Global Navigation Satellite System. Researchers compared multiple observations of the same locations made between 2015 to 2023 using a processing technique called interferometric synthetic aperture radar (InSAR).
Scientists mapped land sinking (indicated in blue) in coastal California cities and in parts of the Central Valley due to factors like soil compaction, erosion, and groundwater withdrawal. They also tracked uplift hot spots (shown in red), including in Long Beach, a site of oil and gas production.
NASA Earth Observatory
Homing in on the San Francisco Bay Area — specifically, San Rafael, Corte Madera, Foster City, and Bay Farm Island — the team found the land subsiding at a steady rate of more than 0.4 inches (10 millimeters) per year due largely to sediment compaction. Accounting for this subsidence in the lowest-lying parts of these areas, local sea levels could rise more than 17 inches (45 centimeters) by 2050. That’s more than double the regional estimate of 7.4 inches (19 centimeters) based solely on tide gauge projections.
Not all coastal locations in California are sinking. The researchers mapped uplift hot spots of several millimeters per year in the Santa Barbara groundwater basin, which has been steadily replenishing since 2018. They also observed uplift in Long Beach, where fluid extraction and injection occur with oil and gas production.
The scientists further calculated how human-induced drivers of local land motion increase uncertainties in the sea level projections by up to 15 inches (40 centimeters) in parts of Los Angeles and San Diego counties. Reliable projections in these areas are challenging because the unpredictable nature of human activities, such as hydrocarbon production and groundwater extraction, necessitating ongoing monitoring of land motion.
Fluctuating Aquifers, Slow-Moving Landslides
In the middle of California, in the fast-sinking parts of the Central Valley (subsiding as much as 8 inches, or 20 centimeters, per year), land motion is influenced by groundwater withdrawal. Periods of drought and precipitation can alternately draw down or inflate underground aquifers. Such fluctuations were also observed over aquifers in Santa Clara in the San Francisco Bay Area, Santa Ana in Orange County, and Chula Vista in San Diego County.
Along rugged coastal terrain like the Big Sur mountains below San Francisco and Palos Verdes Peninsula in Los Angeles, the team pinpointed local zones of downward motion associated with slow-moving landslides. In Northern California they also found sinking trends at marshlands and lagoons around San Francisco and Monterey bays, and in Sonoma County’s Russian River estuary. Erosion in these areas likely played a key factor.
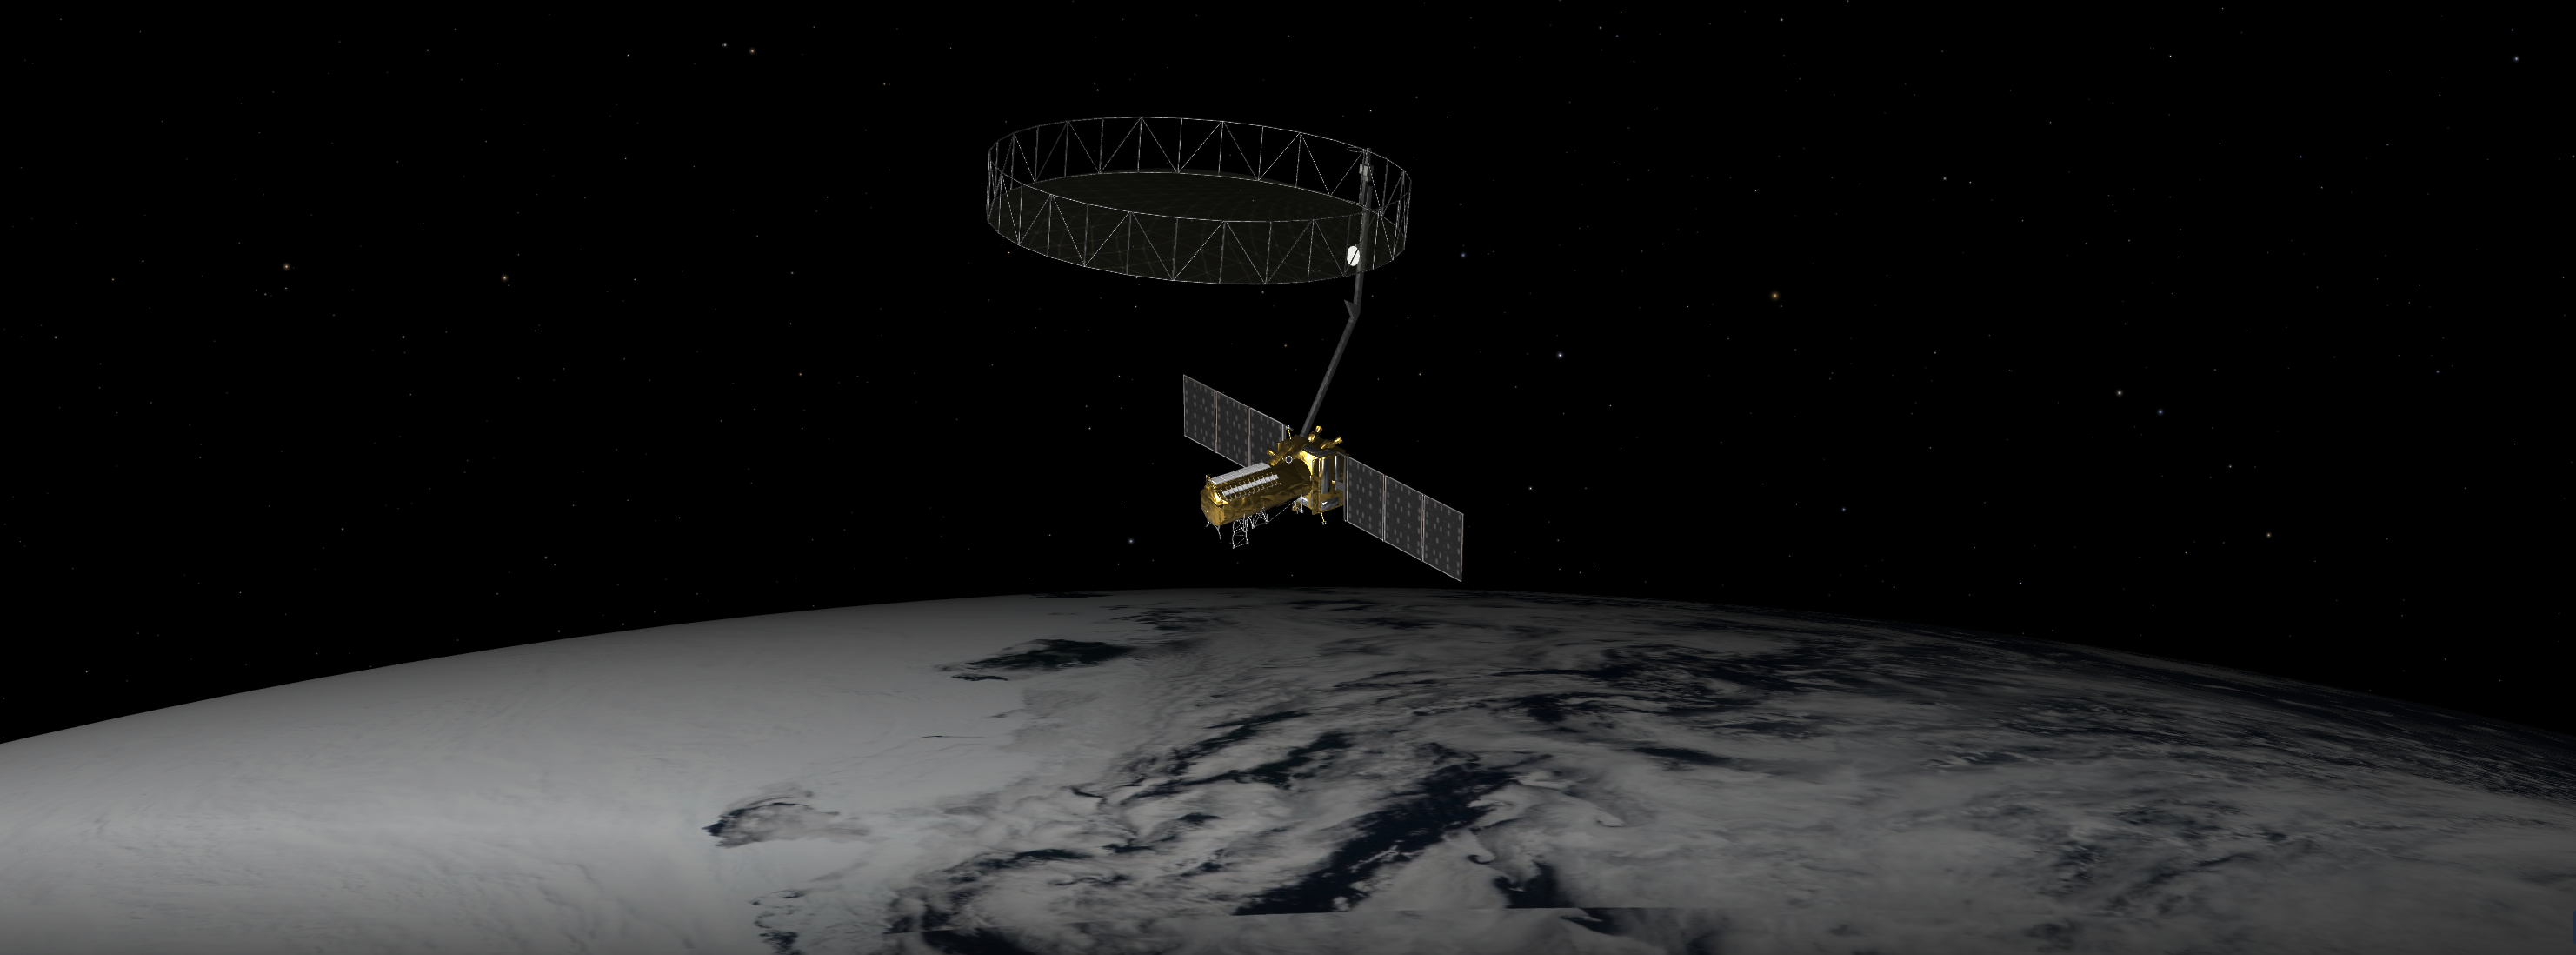
Scientists, decision-makers, and the public can monitor these and other changes occurring via the JPL-led OPERA (Observational Products for End-Users from Remote Sensing Analysis) project. The OPERA project details land surface elevational changes across North America, shedding light on dynamic processes including subsidence, tectonics, and landslides.
The OPERA project will leverage additional state-of-the-art InSAR data from the upcoming NISAR (NASA-Indian Space Research Organization Synthetic Aperture Radar) mission, expected to launch within the coming months.
Newly Minted Ph.D. Studies Phytoplankton with NASA’s FjordPhyto Project
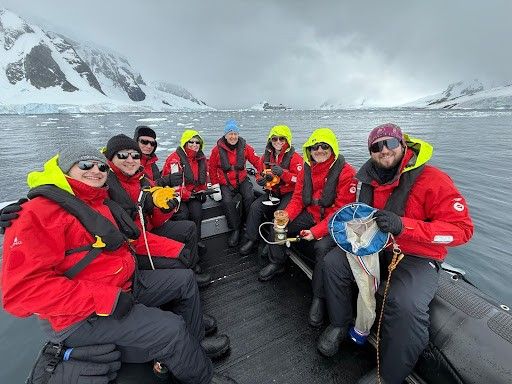
Adventurous travellers aboard the Viking Octantis ship, sampling phytoplankton from Danco Island in the Errera Channel for the FjordPhyto project.
Allison Cusick
FjordPhyto is a collective effort where travelers on tour expedition vessels in Antarctica help scientists at Scripps Institution of Oceanography and Universidad Nacional de La Plata study phytoplankton. Now project leader Dr. Allison Cusick has a Ph.D.! . Dr. Cusick studies how melting glaciers influence phytoplankton in the coastal regions. She wrote her doctoral dissertation based on the data collected by FjordPhyto volunteers.
“Travelers adventure to the wild maritime climate of Antarctica and help collect samples from one of the most data-limited regions of the world,” said Cusick. “While on vacation, they can volunteer to join a FjordPhyto science boat experience where they spend an hour collecting water measurements like salinity, temperature, chlorophyll-a, turbidity, as well as physical samples for molecular genetics work, microscopy identification, and carbon biomass estimates. It’s a full immersion into the ecosystem and the importance of polar research!”
Cusick successfully defended her thesis on December 18, 2024, earning a Ph.D. in Oceanography from the Scripps Institution of Oceanography. Hers is the second Ph.D. based on data from the FjordPhyto project. Martina Mascioni from FjordPhyto team earned her Ph.D. from the National University of La Plata (Argentina) in 2023.
The project is a hit with travelers, too.
“It’s incredibly inspiring to be part of a program like this that’s open to non-specialist involvement,” said one volunteer, a retired biology teacher aboard the Viking Octantis ship, who continued to say, “Thank you for letting us be a part of the science and explaining so clearly why it matters to the bigger picture.”
If you would like to get involved, go to www.fjordphyto.org and reach out to the team!
Preparations for Next Moonwalk Simulations Underway (and Underwater)
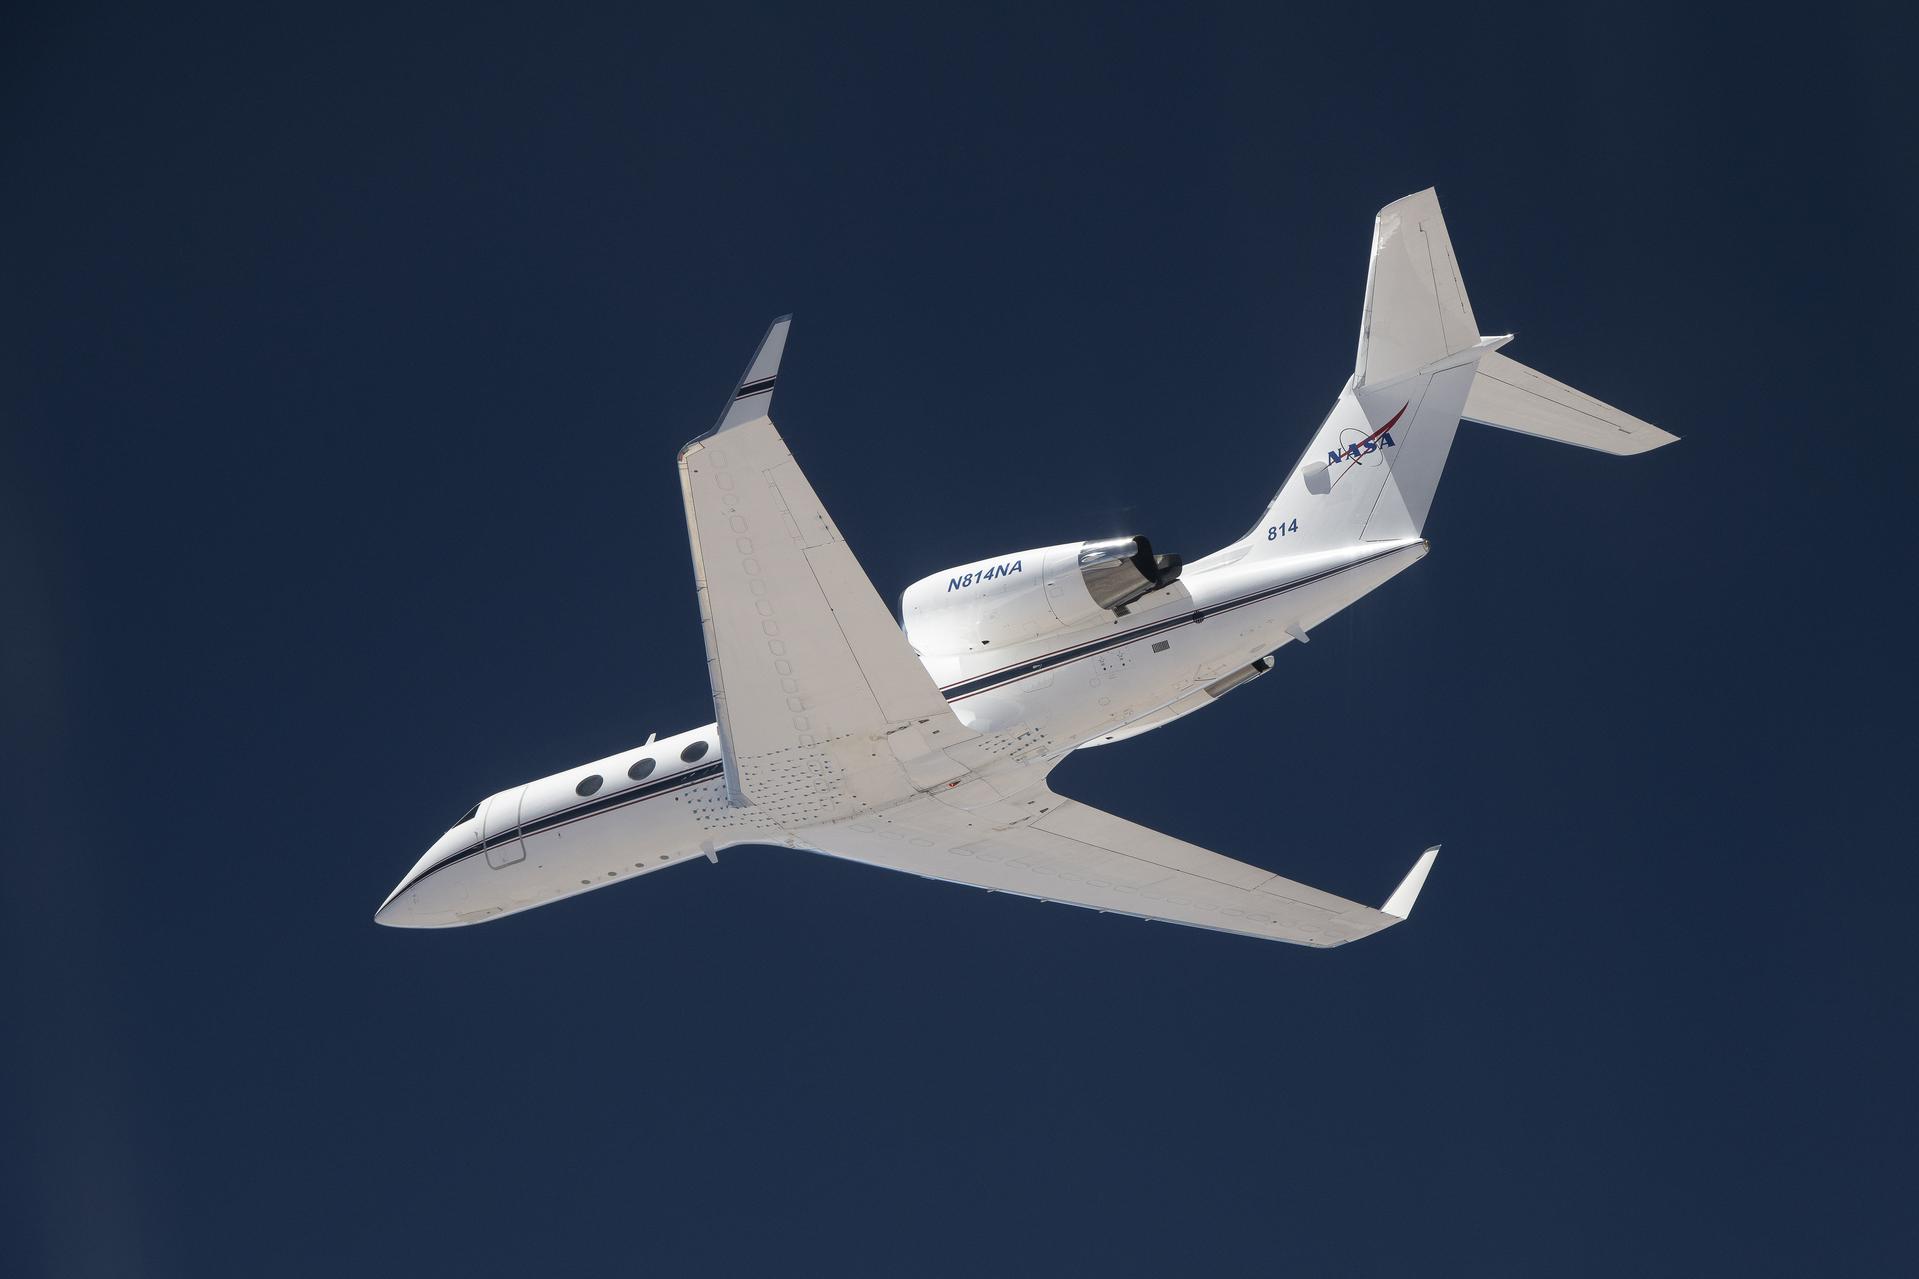
The G-IV aircraft flies overhead in the Mojave Desert near NASA’s Armstrong Flight Research Center in Edwards, California. Baseline flights like this one occurred in June 2024, and future flights in service of science research will benefit from the installment of the Soxnav navigational system, developed in collaboration with NASA’s Jet Propulsion Laboratory in Southern California and the Bay Area Environmental Research Institute in California’s Silicon Valley. This navigational system provides precise, economical aircraft guidance for a variety of aircraft types moving at high speeds.
NASA/Carla Thomas
NASA and its partners recently tested an aircraft guidance system that could help planes maintain a precise course even while flying at high speeds up to 500 mph. The instrument is Soxnav, the culmination of more than 30 years of development of aircraft navigation systems.
NASA’s G-IV aircraft flew its first mission to test this navigational system from NASA’s Armstrong Flight Research Center in Edwards, California, in December 2024. The team was composed of engineers from NASA Armstrong, NASA’s Jet Propulsion Laboratory in Southern California, and the Bay Area Environmental Research Institute (BAERI) in California’s Silicon Valley.
“The objective was to demonstrate this new system can keep a high-speed aircraft within just a few feet of its target track, and to keep it there better than 90% of the time,” said John Sonntag, BAERI independent consultant co-developer of Soxnav.
With 3D automated steering guidance, Soxnav provides pilots with a precision approach aid for landing in poor visibility. Previous generations of navigational systems laid the technical baseline for Soxnav’s modern, compact, and automated iteration.
“The G-IV is currently equipped with a standard autopilot system,” said Joe Piotrowski Jr., operations engineer for the G-IV. “But Soxnav will be able to create the exact level flight required for Next Generation Airborne Synthetic Aperture Radar (AirSAR-NG) mission success.”
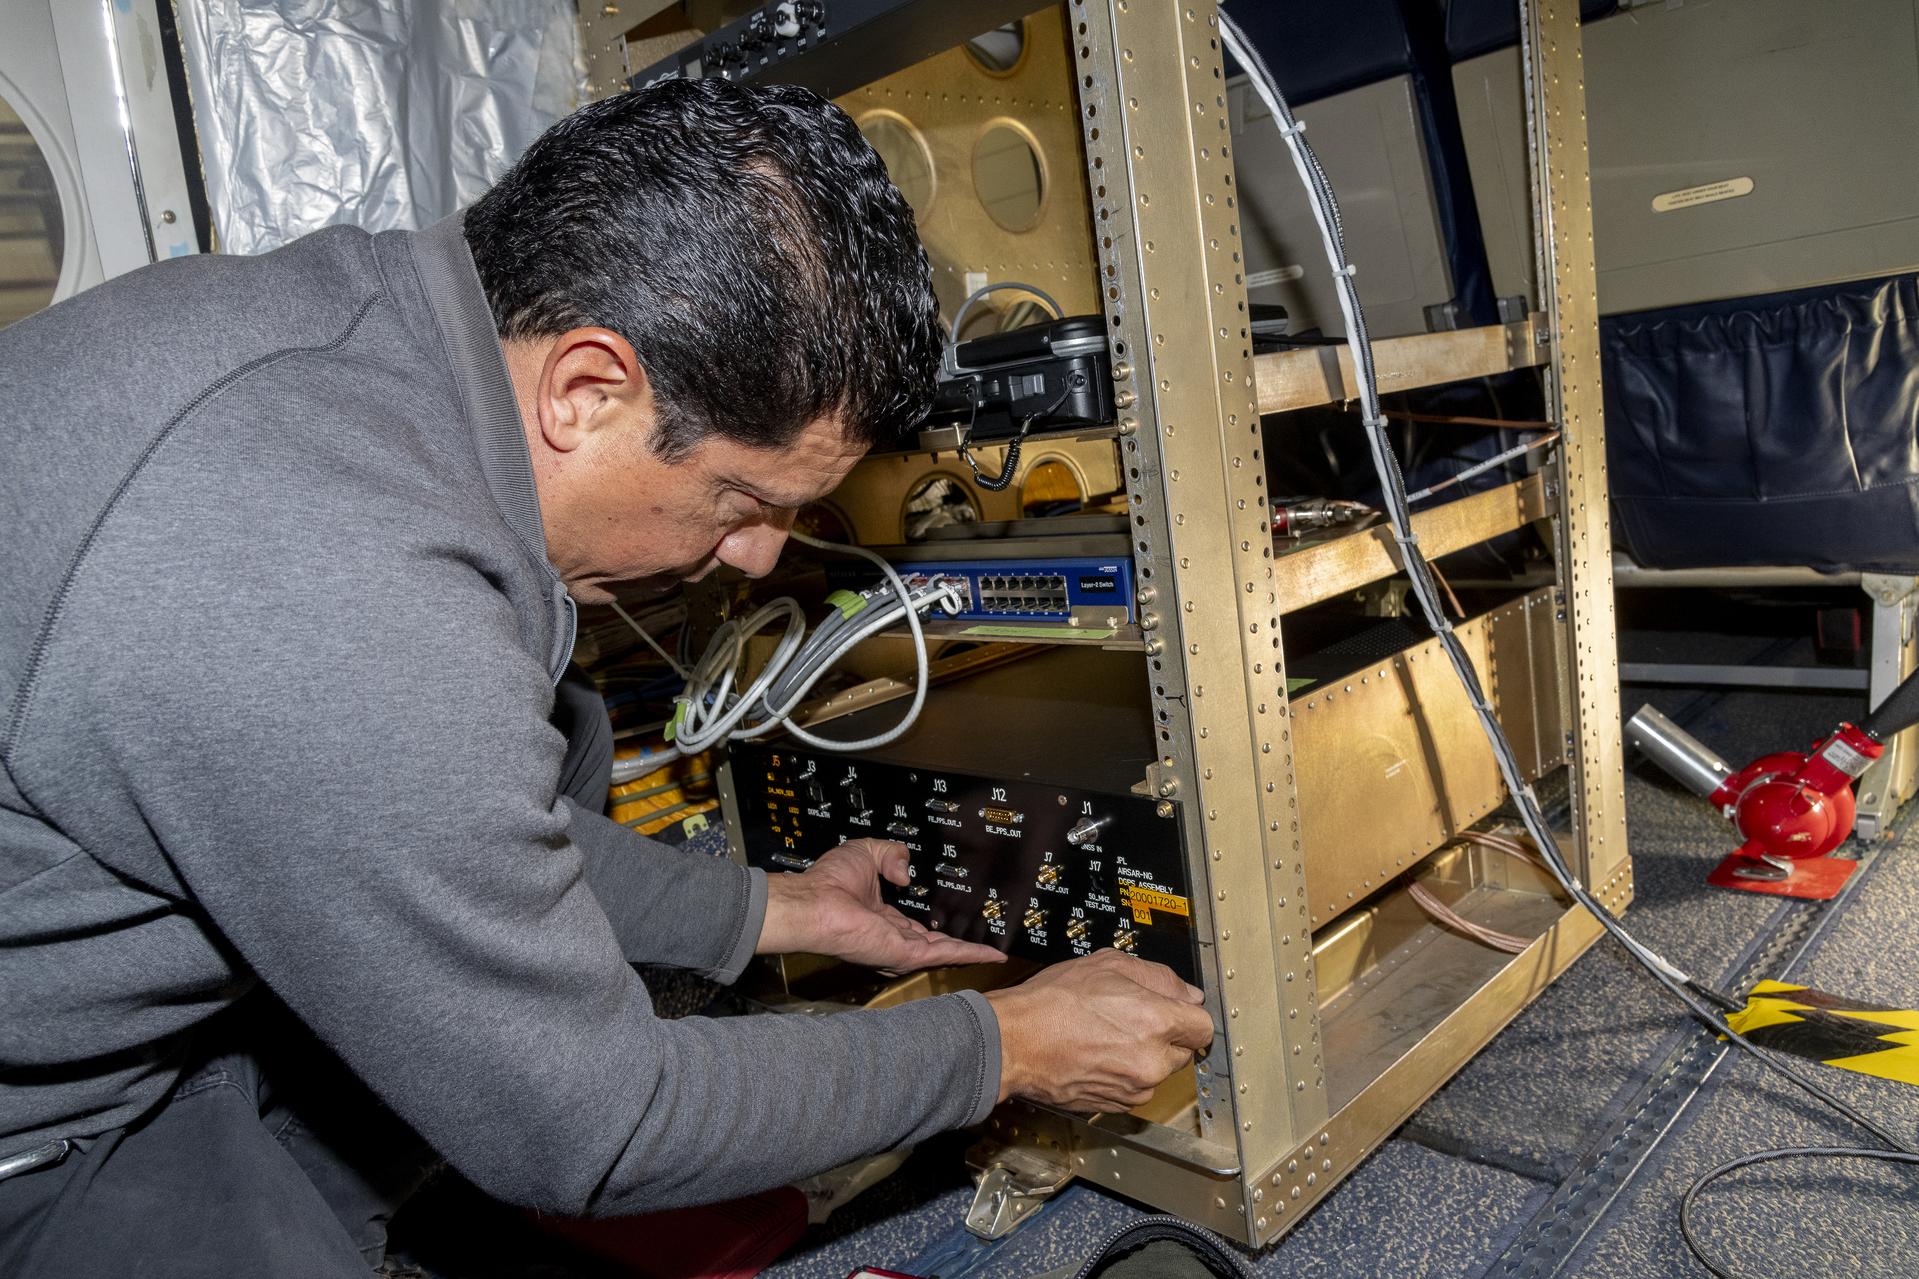
Jose “Manny” Rodriguez adjusts the Soxnav instrument onboard the G-IV aircraft in December 2024. As part of the team of experts, Rodriguez ensures that the electronic components of this instrument are installed efficiently. His expertise will help bring the innovative navigational guidance of the Soxnav system to the G-IV and the wider airborne science fleet at NASA. Precision guidance provided by the Soxnav enables research aircraft like the G-IV to collect more accurate, more reliable Earth science data to scientists on the ground.
NASA/Steve Freeman
Guided by Soxnav, the G-IV may be able to deliver better, more abundant, and less expensive scientific information. For instance, the navigation tool optimizes observations by AirSAR-NG, an instrument that uses three radars simultaneously to observe subtle changes in the Earth’s surface. Together with the Soxnav system, these three radars provide enhanced and more accurate data about Earth science.
“With the data that can be collected from science flights equipped with the Soxnav instrument, NASA can provide the general public with better support for natural disasters, tracking of food and water supplies, as well as general Earth data about how the environment is changing,” Piotrowski said.
Ultimately, this economical flight guidance system is intended to be used by a variety of aircraft types and support a variety of present and future airborne sensors. “The Soxnav system is important for all of NASA’s Airborne Science platforms,” said Fran Becker, project manager for the G-IV AirSAR-NG project at NASA Armstrong. “The intent is for the system to be utilized by any airborne science platform and satisfy each mission’s goals for data collection.”
In conjunction with the other instruments outfitting the fleet of airborne science aircraft, Soxnav facilitates the generation of more abundant and higher quality scientific data about planet Earth. With extreme weather events becoming increasingly common, quality Earth science data can improve our understanding of our home planet to address the challenges we face today, and to prepare for future weather events.
“Soxnav enables better data collection for people who can use that information to safeguard and improve the lives of future generations,” Sonntag said.
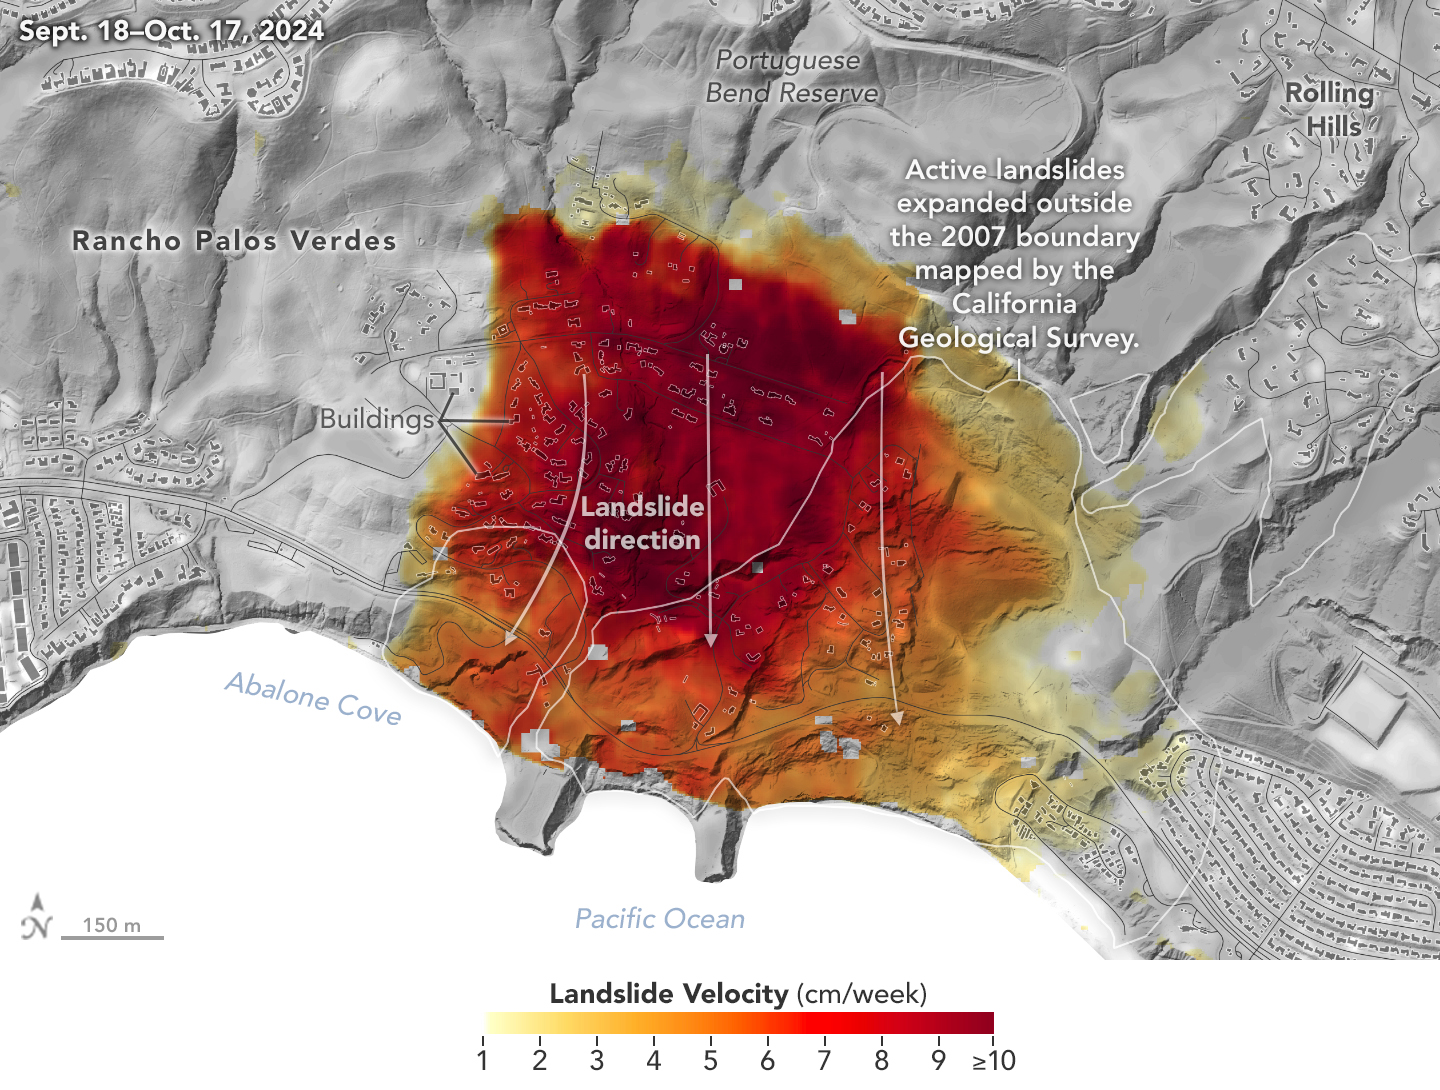
NASA’s UAVSAR airborne radar instrument captured data in fall 2024 showing the motion of landslides on the Palos Verdes Peninsula following record-breaking rainfall in Southern California in 2023 and another heavy-precipitation winter in 2024. Darker red indicates faster motion.
NASA Earth Observatory
Analysis of data from NASA radar aboard an airplane shows that the decades-old active landslide area on the Palos Verdes Peninsula has expanded.
Researchers at NASA’s Jet Propulsion Laboratory in Southern California used data from an airborne radar to measure the movement of the slow-moving landslides on the Palos Verdes Peninsula in Los Angeles County. The analysis determined that, during a four-week period in the fall of 2024, land in the residential area slid toward the ocean by as much as 4 inches (10 centimeters) per week.
Portions of the peninsula, which juts into the Pacific Ocean just south of the city of Los Angeles, are part of an ancient complex of landslides and has been moving for at least the past six decades, affecting hundreds of buildings in local communities. The motion accelerated, and the active area expanded following record-breaking rainfall in Southern California in 2023 and heavy precipitation in early 2024.
To create this visualization, the Advanced Rapid Imaging and Analysis (ARIA) team used data from four flights of NASA’s Uninhabited Aerial Vehicle Synthetic Aperture Radar (UAVSAR) that took place between Sept. 18 and Oct. 17. The UAVSAR instrument was mounted to a Gulfstream III jet flown out of NASA’s Armstrong Flight Research Center in Edwards, California, and the four flights were planned to estimate the speed and direction of the landslides in three dimensions.
In the image above, colors indicate how fast parts of the landslide complex were moving in late September and October, with the darkest reds indicating the highest speeds. The arrows represent the direction of horizontal motion. The white solid lines are the boundaries of the active landslide area as defined in 2007 by the California Geological Survey.
“In effect, we’re seeing that the footprint of land experiencing significant impacts has expanded, and the speed is more than enough to put human life and infrastructure at risk,” said Alexander Handwerger, the JPL landslide scientist who performed the analysis.
The insights from the UAVSAR flights were part of a package of analyses by the ARIA team that also used data from ESA’s (the European Space Agency’s) Copernicus Sentinel-1A/B satellites. The analyses were provided to California officials to support the state’s response to the landslides and made available to the public at NASA’s Disaster Mapping Portal.
Handwerger is also the principal investigator for NASA’s upcoming Landslide Climate Change Experiment, which will use airborne radar to study how extreme wet or dry precipitation patterns influence landslides. The investigation will include flights over coastal slopes spanning the California coastline.
More About ARIA, UAVSAR
The ARIA mission is a collaboration between JPL and Caltech, which manages JPL for NASA, to leverage radar and optical remote-sensing, GPS, and seismic observations for science as well as to aid in disaster response. The project investigates the processes and impacts of earthquakes, volcanoes, landslides, fires, subsurface fluid movement, and other natural hazards.
UAVSAR has flown thousands of radar missions around the world since 2007, studying phenomena such as glaciers and ice sheets, vegetation in ecosystems, and natural hazards like earthquakes, volcanoes, and landslides.
Measurements from space support wildfire risk predictions
Researchers demonstrated that data from the International Space Station’s ECOsystem Spaceborne Thermal Radiometer Experiment on Space Station (ECOSTRESS) instrument played a significant role in the ability of machine learning algorithms to predict wildfire susceptibility. This result could help support development of effective strategies for predicting, preventing, monitoring, and managing wildfires.
As the frequency and severity of wildfires increases worldwide, experts need reliable models of fire susceptibility to protect public safety and support natural resource planning and risk management. ECOSTRESS measures evapotranspiration, water use efficiency, and other plant-water dynamics on Earth. Researchers report that its water use efficiency data consistently emerged as the leading factor in predicting wildfires, with evaporative stress and topographic slope data also significant.
This ECOsystem Spaceborne Thermal Radiometer Experiment on Space Station evapotranspiration image of California’s Central Valley in May 2022 shows high water use (blue) and dry conditions (brown).
NASA
Combining instruments provides better emissions data
Scientists found that averaging data from the International Space Station’s OCO‐3 and EMIT external instruments can accurately measure the rate of carbon dioxide emissions from power plants. This work could improve emissions monitoring and help communities respond to climate change.
Carbon dioxide emissions from fossil fuel combustion make up nearly a third of human-caused emissions and are a major contributor to climate change. In many places, though, scientists do not know exactly how much carbon dioxide these sources emit. The Orbiting Carbon Observatory-3 or OCO-3 can quantify emissions over large areas and Earth Surface Mineral Dust Source Investigation data can help determine emissions from individual facilities. The researchers suggest future work continue to investigate the effect of wind conditions on measurements.
The The Orbiting Carbon Observatory-3 data showing carbon dioxide concentrations in Los Angeles.
NASA
Thunderstorm phenomena observed from space
Observations by the International Space Station’s Atmosphere-Space Interactions Monitor (ASIM) instrument during a tropical cyclone in 2019 provide insight into the formation and nature of blue corona discharges often observed at the tops of thunderclouds. A better understanding of such processes in Earth’s upper atmosphere could improve atmospheric models and weather and climate predictions.
Scientists do not fully understand the conditions that lead to formation of blue corona discharges, bursts of electrical streamers, which are precursors to lightning. Observations from the ground are affected by scattering and absorption in the clouds. ASIM, a facility from ESA (European Space Agency), provides a unique opportunity for observing these high-atmosphere events from space.
View of Atmosphere-Space Interactions Monitor, the white and blue box on the end of the International Space Station’s Columbus External Payload Facility.
Summary of the 2024 NASA LCLUC Science Team Meeting
Introduction
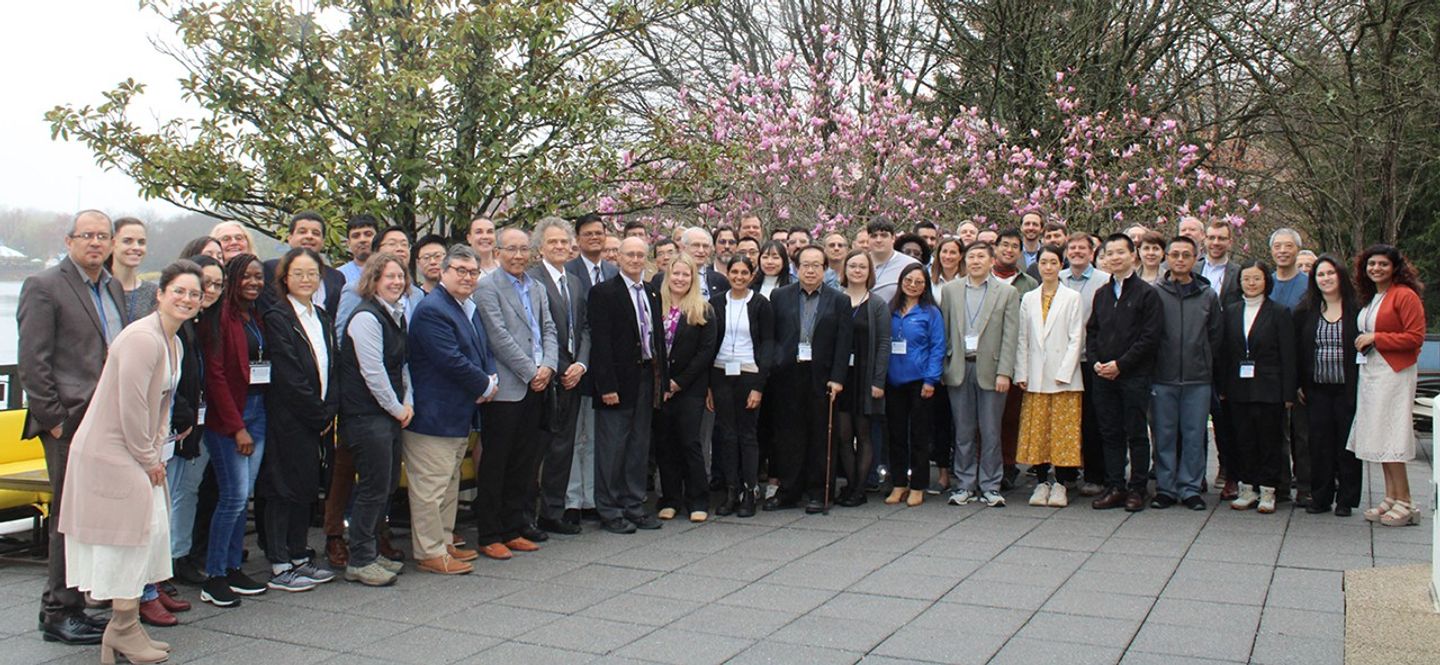
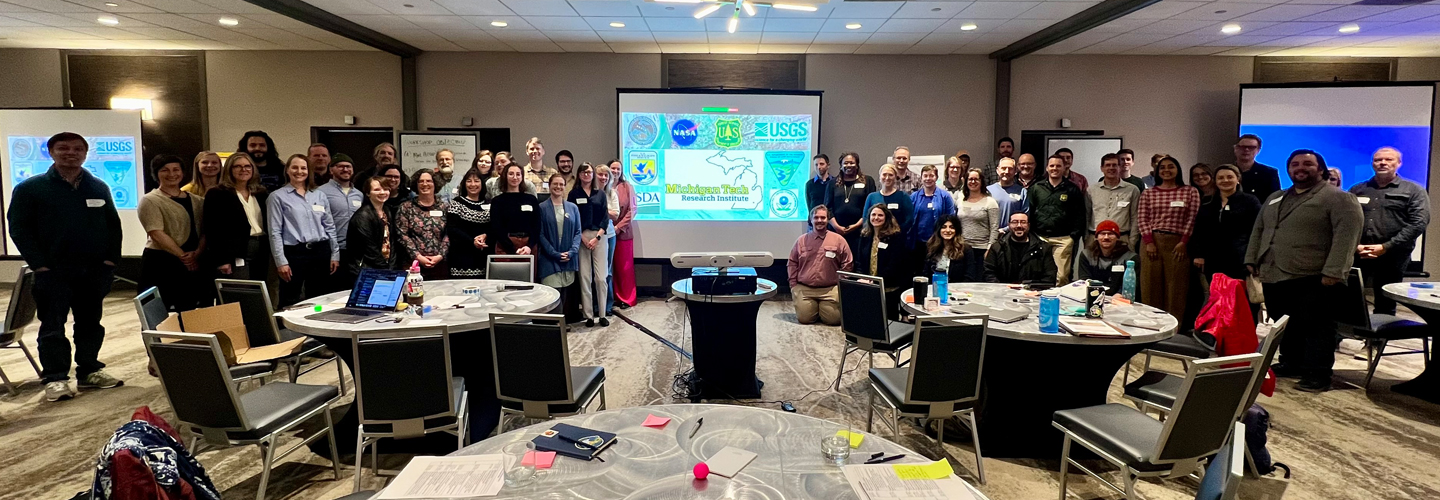
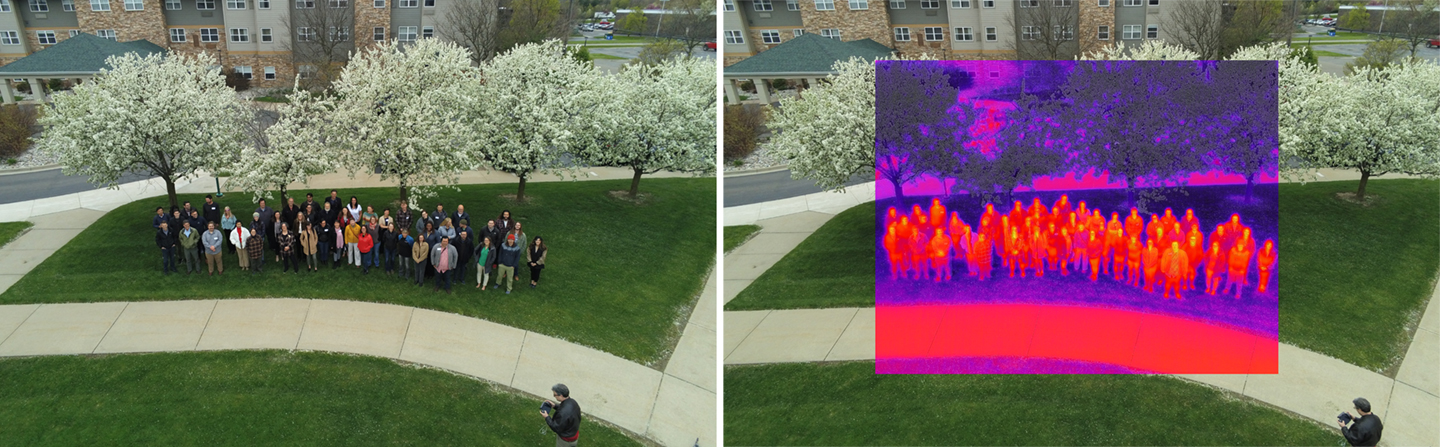
The 2024 NASA Land-Cover and Land-Use Change (LCLUC) Science Team Meeting (STM) took place from April 2–4, 2024 at the Marriott Washingtonian Center in Gaithersburg, MD. During the meeting, 75 people attended in-person. Represented among the attendees were LCLUC project investigators and collaborators, NASA Headquarters (HQ) program managers, and university researchers and students – see Photo.
LCLUC is an interdisciplinary scientific program within NASA’s Earth Science program that aims to develop the capability for periodic global inventories of land use and land cover from space. The program’s goal is to develop the scientific understanding and models necessary to simulate the processes taking place and to evaluate the consequences of observed and predicted changes.
The LCLUC program’s focus is divided into three areas – impacts, monitoring, and synthesis. Each category constitutes about one-third of the program’s content. The LCLUC program is part of the Carbon Cycle and Ecosystems research area, alongside other programs, such as Terrestrial Ecosystems, Ocean Biology and Biogeochemistry, and Biodiversity.
Principal Investigators (PIs) who participate in LCLUC are required to provide free and open access to their data and products via their metadata pages, aligning with NASA’s Transform to Open Science (TOPS) initiative. The program organizes at least one international regional workshop and one domestic ST meeting each year to share LCLUC science and foster global collaborations, contributing to regional capacity-building as an added value. Additionally, the program hosts regular webinars led by PIs on topics such as agriculture, urban areas, land-use changes in conflict zones, and natural disaster hotspots (i.e., fires, droughts, and floods). Garik Gutman [NASA HQ—LCLUC Program Manager] presented updates on LCLUC research publications, journal special issues, and upcoming international meetings.
The remainder of this article summarizes the highlights of the 2024 LCLUC STM. The content is organized chronologically, with a section devoted to describing each day of the meeting and descriptive headers throughout. The full presentations from this meeting are available on the LCLUC meeting website.
Photo. A group picture of meeting participants on the first day of the 2024 LCLUC meeting in Gaithersburg, MD.
Photo credit: Hotel staff (Marriott Washingtonian Center, Gaithersburg, MD)
DAY ONE
The first day featured invited presentations, reports from LCLUC ST members funded through the LCLUC Research Opportunities in Space and Earth Sciences (ROSES) 2022 selections, and an overview of SARI. The day concluded with poster presentations and lightning talks highlighting recent results from ongoing LCLUC-related research.
Update from the LCLUC Program Manager
The meeting began with welcoming remarks from Garik Gutman, who provided an update on the program’s latest developments and achievements. He highlighted that the socioeconomic component is an integral part of most LCLUC projects. The program has recently expanded to include multisource land imaging, such as the ESA’s Copernicus Sentinel program, regional initiatives, and capacity-building efforts. He also underscored the importance of U.S. missions relevant to LCLUC, which produce spatially coarse resolution daily data from the Moderate Resolution Imaging Spectroradiometer (MODIS) on NASA’s Aqua and Terra platforms and the NASA–National Oceanic and Atmospheric Administration (NOAA) Visible Infrared Imaging Radiometer Suite (VIIRS) on the Suomi National Polar-orbiting Partnership (Suomi NPP); spatially moderate resolution data every eight days from the NASA–USGS Landsat-8 (L8) and Landsat-9 (L9) satellites; and very high-resolution data from private companies, such as Planet Inc. and Maxar.
Jack Kaye [ESD—Associate Director for Research] gave an update on ESD activities that reflected on NASA’s broad capabilities in Earth Science – emphasizing the agency’s unique role in both developing and utilizing cutting-edge technology. Unlike many other agencies, NASA’s scope spans technology development, research, data provision, and tool creation. Over the past 16 months, NASA has launched several significant missions, including SWOT, Time-Resolved Observations of Precipitation structure and storm Intensity with a Constellation of Smallsats (TROPICS), Tropospheric Emissions: Monitoring of Pollution (TEMPO), and Plankton, Aerosol, Cloud, ocean Ecosystem (PACE). This surge in satellite launches highlights NASA’s role in enhancing global observational capabilities. NASA also supports a diverse array of programs, including airborne campaigns and surface-based measurement networks. Initiatives aim to improve the involvement of minority-serving institutions and incorporate open science practices with a focus on enhancing inclusivity and expanding participation. The agency also emphasizes the importance of peer review and collaboration with international and community-based partners. Kaye highlighted NASA’s commitment to producing high-quality, actionable science while navigating financial and operational challenges. This commitment extends to addressing environmental and societal impacts through programs such as Earth Action and by fostering global collaboration.
Sid Ahmed Boukabara [ESD—Senior Program Scientist for Strategy] presented a detailed overview of NASA’s Earth Science to Action Strategy, which aims to increase the impact of Earth science in addressing global challenges. This strategy acknowledges the urgency of global changes, e.g., accelerating environmental shifts, understanding Earth’s interconnected systems, and developing scalable information. NASA’s mission focuses on observing and understanding the Earth system, delivering trusted information, and empowering resilience activities through advanced technologies, partnerships, and innovations. Key principles include amplifying impact through partnerships, engaging a diverse and inclusive workforce, balancing innovation with sustainability, encouraging cutting-edge capabilities, and ensuring robust and resilient processes. The strategy emphasizes collaboration across sectors and international partnerships to leverage Earth observations enhance the value of Earth science for decision-making and policy support. The strategy also highlights the role of land-cover and land-use change activities in supporting objectives and enhancing modeling capabilities.
Thomas Wagner [ESD—Associate Director for Earth Action] outlined NASA’s Earth Action initiative (formerly known as the Applications Program), which focuses on user-centered strategies to address global challenges, e.g., climate resilience, health, and ecological conservation. By integrating applied sciences and leveraging satellite data, the initiative aims to enhance Earth observation capabilities and connect scientific research with practical applications to meet societal needs. The strategy includes a virtuous cycle, where user feedback informs the development of future programs and missions, ensuring that research and technology are aligned with real-world needs. Additionally, Earth Action emphasizes public engagement by offering open-source models and data to enhance understanding and support decision making. Through multisector consortia and problem-solving teams, the initiative addresses urgent and broad-impact issues, fostering innovation and collaboration.
Updates from LCLUC PIs on 2022 ROSES Proposal Selections
Following the programmatic overview presentations, PIs presented updates on research results from LCLUC ROSES 2022 proposal selections. Gillian Galford [University of Vermont] presented on the socioeconomic and environmental dynamics of LCLUC in the Cerrado frontier of Brazil. She presented results from the three main objectives: developing LCLUC detection methods and datasets, characterizing major land-use transitions (LUTs), and understanding the drivers behind these transitions. The research employs remote-sensing and geostatistical methods to track changes, identify “hotspots” of activity, and understand the underlying motivations for land-use changes. The research aims to provide insights that can guide conservation efforts and promote sustainable land use in the region.
Gustavo Oliveira [Clark University] presented “Irrigation as Climate-Change Adaptation in the Cerrado Biome of Brazil.” This project aims to develop methods for analyzing LCLUC data and their socioeconomic impacts, examining the expansion of irrigated agriculture and creating models to inform policy on agrarian development and water regulations. Oliveira highlighted areas of significant deforestation and the rapid growth of irrigated agriculture in the study region – positioning Western Bahia as a model for irrigation in Brazil. He explained that the research outputs include software for time series analysis and publications on land change, contributing to the broader understanding of climate adaptation strategies in the region.
Grant Connette [Smithsonian Institution] presented “Can Improved Stakeholder Representation Prevent Human-caused Mangrove Loss in the Mesoamerican Reef Ecoregion?” He examined the factors contributing to mangrove loss in the Mesoamerican Reef (MAR) ecoregion. Through a combination of Earth observation data, socioeconomic analysis, and community engagement, Connette described how the study seeks to improve the effectiveness of protected areas and inform best practices for mangrove conservation in the MAR ecoregion.
Saurav Kumar [Arizona State University] presented his team’s work, “Exploring the Nexus between LCLUC, Socio-Economic Factors, and Water for a Vulnerable Arid U.S.–Mexico Transboundary Region.” Kumar explained that the project aims to understand how natural and human systems influence LCLUC when constrained by water availability. The data used in this project come from a combination of time series data, theoretical model output, and artificial intelligence techniques. The team also focuses on stakeholder engagement, recognizing the need for comprehensive identification and involvement in addressing complex water resource issues. Kumar explained that the study seeks to predict future LCLUC transitions, assess the theoretical models of different stakeholder groups, and identify policy-relevant leverage points for sustainable water management.
Abena Boatemaa Asare-Ansah [University of Maryland, College Park (UMD)] presented on “The Multisensor Mapping of Refugee Agricultural LCLUC Hotspots in Uganda.” She explained that this study focuses on mapping changes in cropland within refugee-hosting regions using satellite data and deep learning models. Asare-Ansah described how the first year involved evaluating existing cropland maps and initiating new classifications. Future work will refine these maps and connect cropland changes to specific refugee households, aiming to better understand the relationship between refugee populations, food aid, and agricultural practices.
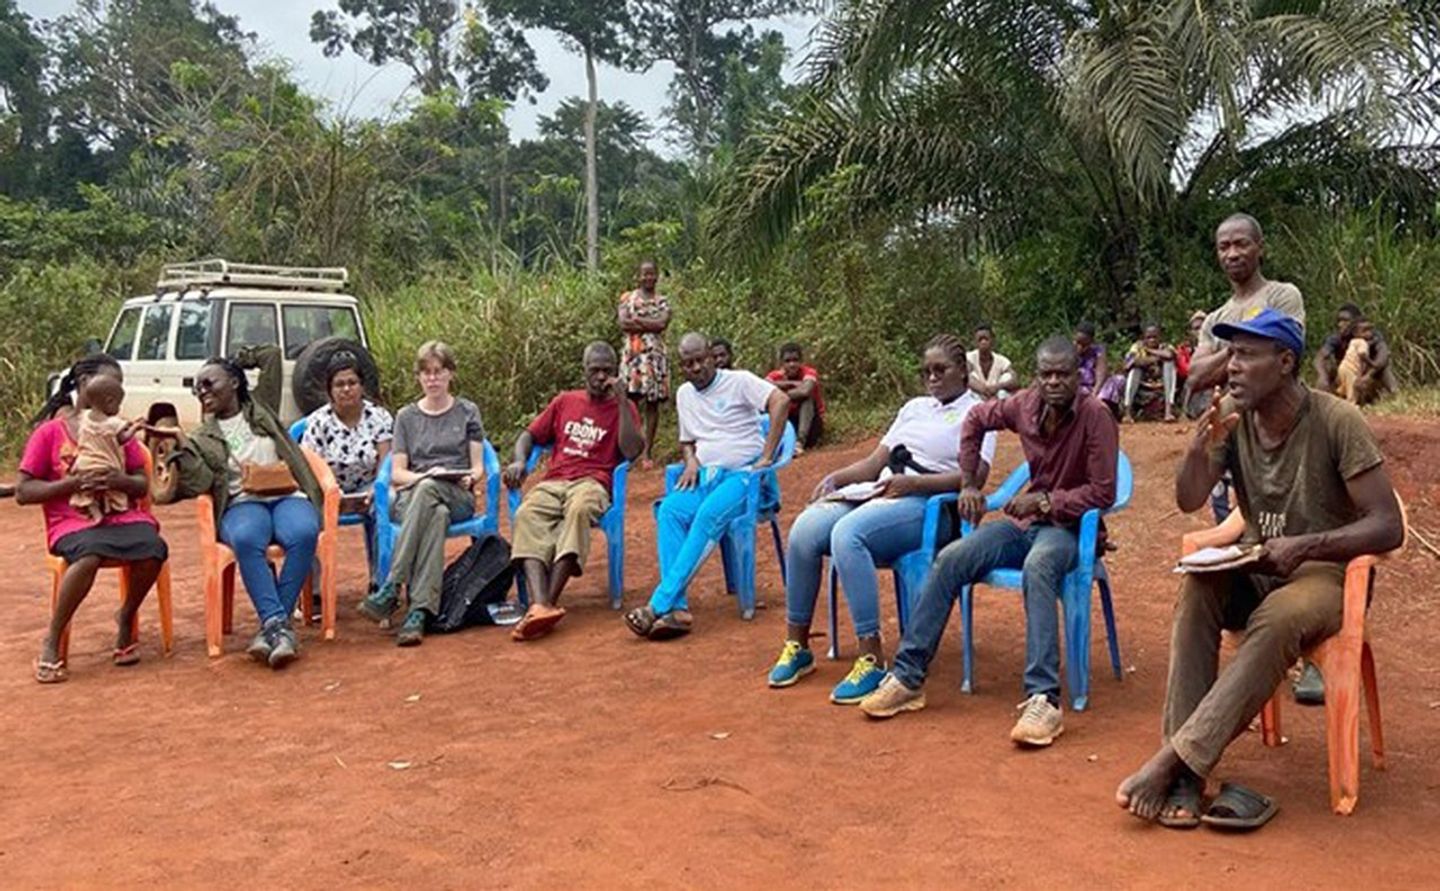
Elsa Ordway [University of California, Los Angeles (UCLA)] discussed her team’s efforts toward “Disentangling Land-Use Change in Central Africa to Understand the Role of Local and Indigenous Communities in Forest Restoration and Conservation.” Ordway reported that the project focuses on mapping land cover and carbon emissions, analyzing the impact of conservation efforts, and exploring potential forest restoration opportunities. She emphasized that this research highlights the critical role of local indigenous communities in forest management and the unintended consequences of conservation projects on land use – see Photo 2.
Photo 2. Some residents of a village neighboring the Dja reserve – part of the dense rain forests that form Africa’s Congo Basin. Interviews and surveys among the area’s local and indigenous communities are used to gather information on forest restoration and conservation.
Photo credit: Else Ordway (UCLA)
Ordway also presented on the PAN-tropical investigation of BioGeochemistry and Ecological Adaptation (PANGEA), which aims to investigate the biogeochemistry and ecological adaptation of tropical forests that are crucial for global climate regulation and biodiversity. She explained that this study emphasizes the rapid changes occurring in tropical regions primarily due to deforestation and climate change. PANGEA seeks to answer key scientific questions about the vulnerability and resilience of these ecosystems, and how this information can inform climate adaptation, mitigation, and biodiversity conservation efforts.
The ARID Experiment
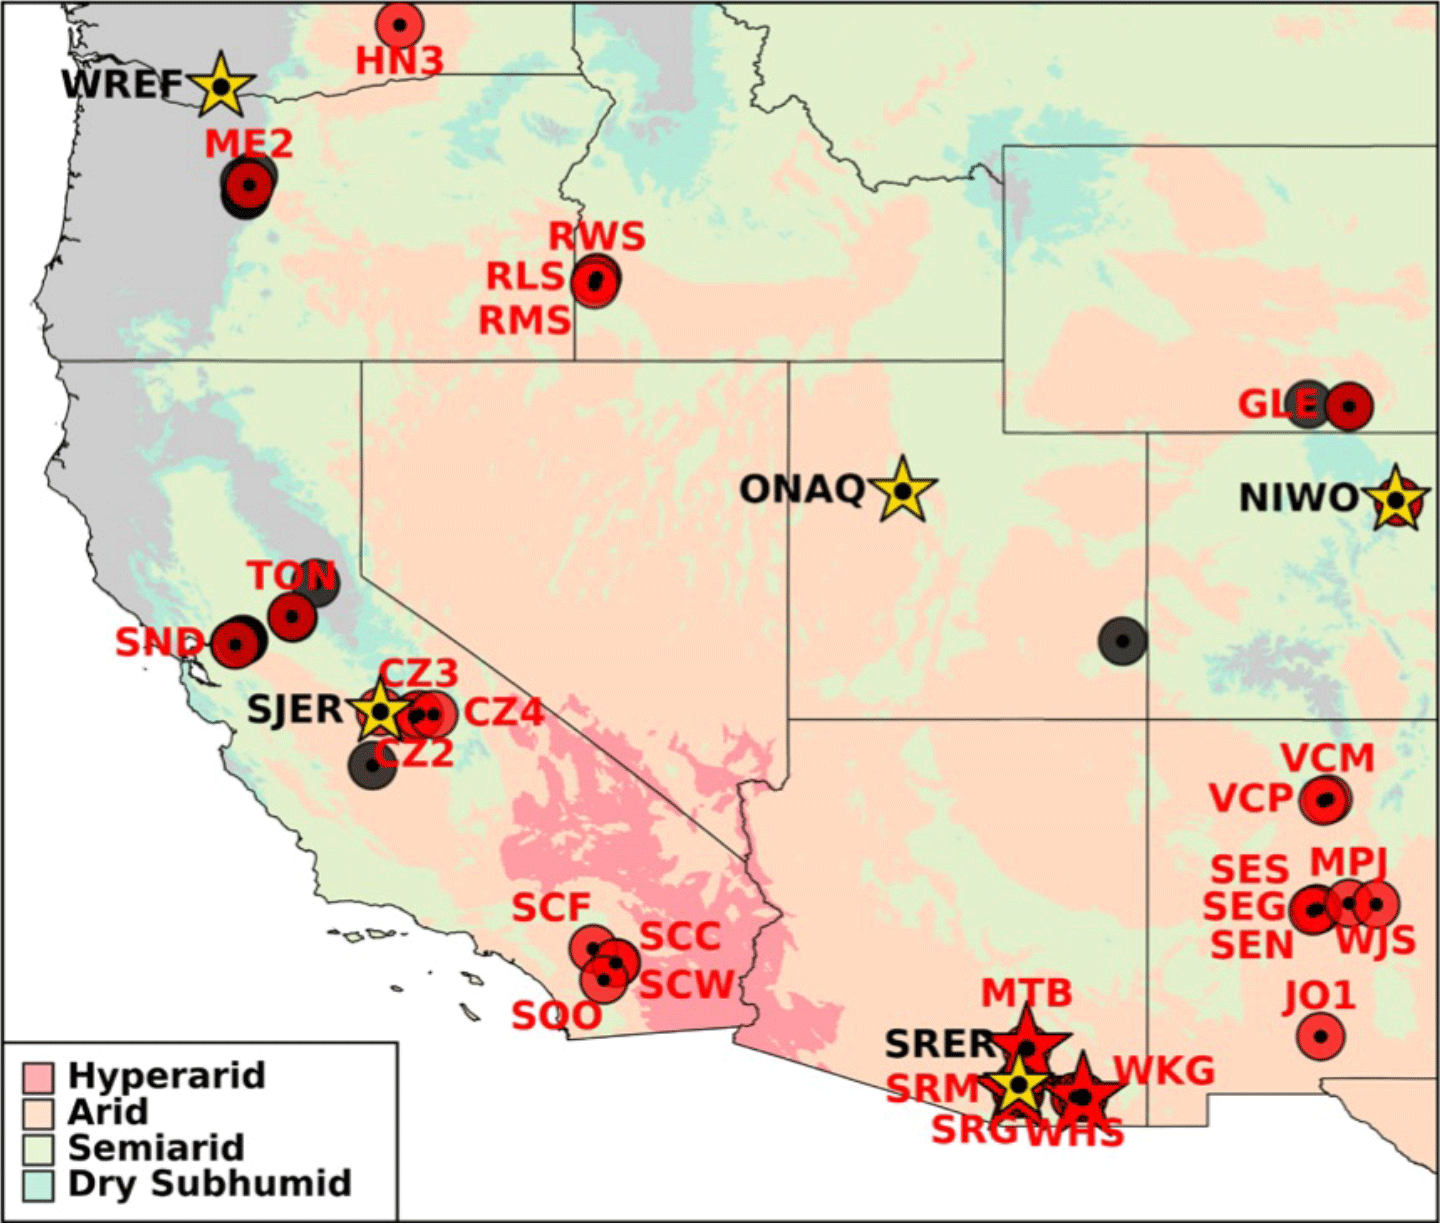
Andrew Feldman [NASA’s Goddard Space Flight Center (GSFC)] presented on the Adaptation and Response in Drylands (ARID) experiment, a field campaign focused on dryland ecosystems. He described how this project aims to understand the fundamental science of drylands, including water availability, land–atmosphere interactions, climate variability, carbon stocks, and land management. The study involves significant international collaboration and stakeholder engagement, with a particular focus on the Western U.S – see Figure 1. While this project is in planning stages, ongoing efforts will be made to engage with the scientific community, gather feedback, and refine its research themes.
Figure 1. The Adaptation and Response in Drylands (ARID) experiment focuses on studying the characteristics of dryland ecosystems, e.g., water availability, land–atmosphere interactions, climate variability, carbon stocks, and land management. While the experiment is global in scope, it has a focus on the Western U.S., with numerous site locations across the desert Southwest and some in the Pacific Northwest.
Figure credit: Andrew Feldman (NASA/UMD)
SARI Update and Related Projects
Krishna Vadrevu [NASA’s Marshall Space Flight Center] gave a comprehensive update on SARI, a regional initiative under the LCLUC program that addresses the critical needs of the South/Southeast Asia region by integrating remote sensing, natural sciences, engineering, and social sciences. His presentation covered the initiative’s background, various funded research projects, and their outputs. The diverse SARI projects include studies on forest degradation, agricultural transitions, food security, urbanization, and their environmental impacts. SARI has supported 35 research projects, engaging more than 400 scientists and over 200 institutions that result in significant scientific contributions, including nearly 450 publications, 16 special journal issues, and five books with two additional books pending publication. Vadrevu emphasized the importance of sustainable land use policies informed by LCLUC research and provided details on upcoming meetings. He concluded with information on three ongoing projects funded under the SARI synthesis solicitation – one in South Asia and two in Southeast Asia. Summaries of these projects are highlighted below.
David Skole [Michigan State University (MSU)] leads the SARI synthesis project that spans South Asian countries, with an emphasis on tree-based systems, particularly Trees Outside Forests (TOF). The primary objective is to synthesize existing research to better understand the patterns, drivers, and impacts of TOF on carbon emissions and removals and their role in supporting rural livelihoods. This research is crucial for informing climate change policy, particularly in the context of nature-based solutions and pathways to achieve net-zero emissions. The project combines empirical data with process-based research and policy models to support the development of sustainable landscapes. By integrating biophysical and socioeconomic data, the project team members aim to provide robust, evidence-based contributions to climate mitigation and adaptation strategies, ultimately guiding regional policy decisions.
Son Nghiem [NASA/Jet Propulsion Laboratory] discussed the interrelated dynamics of LCLUC and demographic changes in Southeast Asia under various developmental pressures and climate change. Nghiem explained that the study explores how these factors interact along the rural-to-urban continuum across regions in Cambodia, the Lao People’s Democratic Republic (Laos), Thailand, Vietnam, Malaysia, and parts of Indonesia. In rapidly urbanizing and agriculturally transitioning areas, physical and human feedback processes are becoming non-stationary, leading to unpredictable impacts that challenge traditional policymaking. The study aims to capture both physical patterns (e.g., land-use) and human (socioeconomic) fabrics, integrating these within a framework to assess whether the statistical properties of the time series measured during this study remain constant or change with time.
Peilei Fan [Tufts University] presented the project, “Decoding Land Transitions Across the Urban-Rural Continuums (URC): A Synthesis Study of Patterns, Drivers, and Socio-Environmental Impacts in Southeast Asia.” The project aims to synthesize knowledge through an interdisciplinary approach. It focuses on URCs in 19 cities across eight Southeast Asian countries. It investigates how global urban hierarchies, URC connectivity, and local policies influence land-use change and related ecosystem impacts. By integrating remote-sensing data with climate and ecological models and socioeconomic analysis, the project seeks to advance theoretical understanding of land transitions and provide valuable insights for both scientific research and policymaking.
The second day of the meeting continued with additional presentations from the LCLUC ROSES 2022 projects and updates from international programs. In addition, the attendees listened to presentations from NASA HQ and NASA Centers, describing various initiatives and data products, such as from the Socio-Economic Data and Applications Center (SEDAC).
Updates from LCLUC PIs on ROSES 2022 Proposal Selections (cont.)
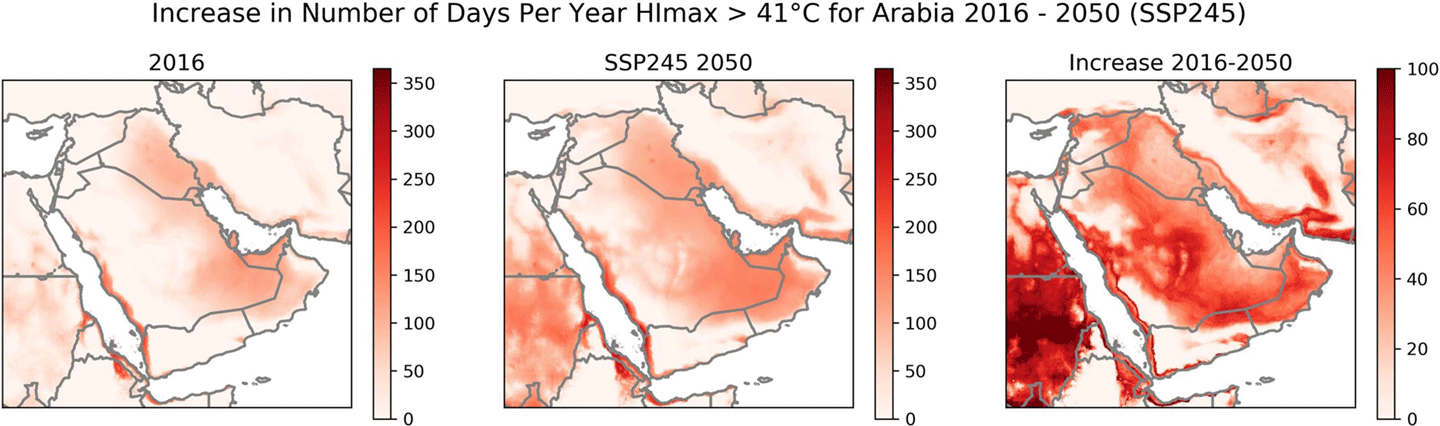
Cascade Tuholske [Montana State University] presented “Modulation of Climate Risks Due to Urban and Agricultural Land Uses in the Arabian Peninsula.” Tuholske explained how this project aims to map LCLUC, assess the effects on extreme humid heat, and characterize the socio-demographics of exposure to heat stress – see Figure 2. Key findings include evidence of a rapid increase in dangerously hot and humid weather – particularly in urban and agricultural areas – and the importance of remote sensing in studying these interactions. Future steps will involve using climate models to predict the effects of LCLUC on heat waves, water stress, and dust storms.
Figure 2. The Ghana Climate Hazards Center Coupled Model Intercomparison Project (CMIP) Phase 6 climate projection dataset map of temperatures exceeding 41 °C (106 °F) [left], future climate projection (SSP) for 2050 [middle], and the difference between the two [right].
Figure credit: From a 2024 paper in the journal Scientific Data
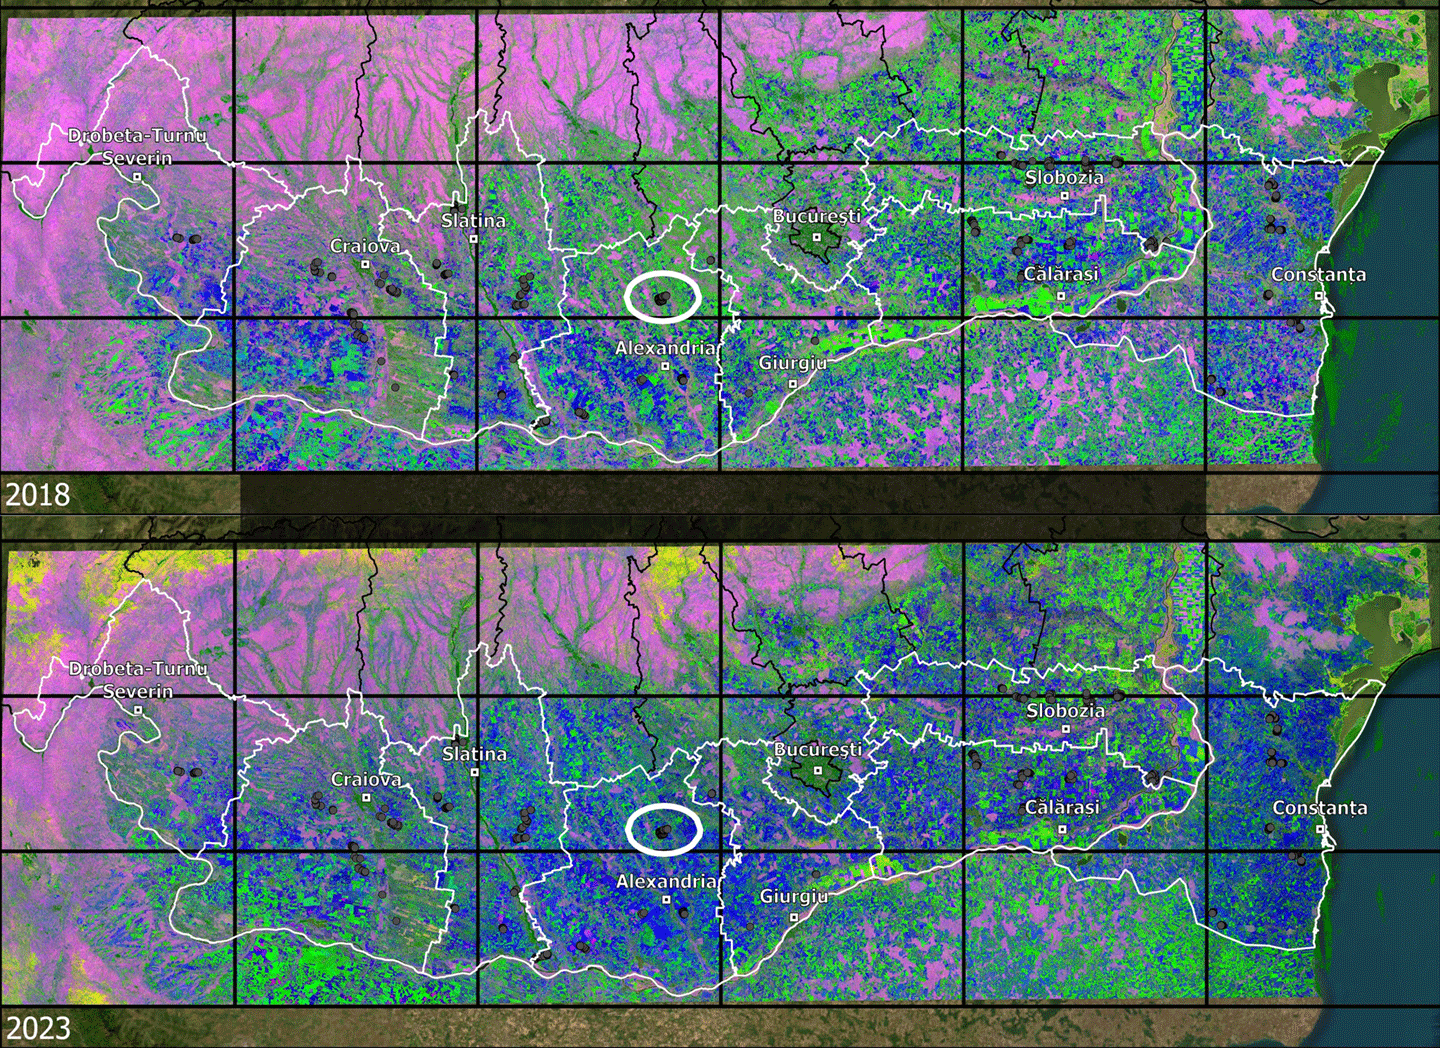
Monika Tomaszewska [MSU] provided details on the project, “Institutional Forcings on Agricultural Landscapes in Post-Socialist Europe: Diachronic Hotspot Analysis of Common Agricultural Policy Influences on Agricultural Land Use in Romania 2002–2024.” She explained that the project focuses on how the EU’s common agricultural policy (CAP) programs (e.g., livelihood payments, environmental protections, and rural development projects) have influenced land use changes – see Figure 3. Tomaszewska summarized key findings from the study, which indicates significant changes in crop composition and spatial patterns – with notable decreases in maize and rapeseed areas between 2018 and 2023. She stated that the study aims to understand the diffusion of innovation through CAP enrollments and payments and their impact on agricultural practices in Romania.
Figure 3. Dense time series of Harmonized Landsat Sentinel-2 (HLS) data at 30-m (98-ft) resolution revealing winter and summer crops across Southern Romania in 2018 [top] and 2023 [bottom]. Magenta areas indicate forests, green areas represent summer crops (e.g., maize, sunflower, soy), and blue areas show winter crops (e.g., wheat, barley, rapeseed). Yellow areas indicate very low spring Enhanced Vegetative Index-2 due to snow or persistent clouds at higher elevations.
Figure credit: Geoff Henebry (MSU)
Xiao-Peng Song [UMD] presented “Energy LCLUC Hotspot: Characterizing the Dynamics of Energy Land Use and Assessing Environmental Impacts in the Permian Basin.” He said that the project aims to assess the environmental impacts of energy-related land-cover and land-use change in the region. Song showed the output from the project, which includes high-resolution LCLUC and geohazard maps that enhance understanding of energy-related environmental impacts and contribute to NASA’s LCLUC program. Results from this study are expected to inform decision makers on societal issues related to oil and gas production and its effects on the environment.
International Partner Program Updates
The International Partners Programs session featured four presentations. Ariane DeBremond [UMD] focused on the Global Land Programme (GLP), which is a comprehensive, global initiative dedicated to understanding and addressing changes in land systems and their implications for sustainability and justice. DeBremond described the program, which coordinates research on land use, land management, and land cover changes,. She emphasized land systems as social-ecological systems and fostering interdisciplinary collaboration to develop solutions for global challenges. The research agenda includes descriptive, normative, and transformative aspects, aimed at characterizing land systems, identifying causes and impacts of changes, and creating pathways for sustainability transformations. GLP also emphasizes the need for new remote-sensing data, improved generalizability, and addressing geographic biases in land system science. Recent program activities include developing a new science plan, identifying emerging themes, and organizing open science meetings. DeBremond ended by announcing that the next GLP meeting is scheduled for November 2024 in Oaxaca, Mexico.
David Skole outlined the efforts of the Global Observations of Forest and Land Cover Dynamics (GOFC–GOLD) Land Implementation Team (LC–IT) in advancing methods and tools for global land cover measurements and monitoring. The LC–IT is primarily focused on developing and evaluating space-borne and in-situ observation techniques to support global change research, forest inventories, and international policy. Skole highlighted the importance of regional networks in coordinating the use of Earth Observation (EO) data, facilitating capacity building, and addressing regional concerns through workshops and partnerships. He also discussed the changing role of EO in responding to climate change and sustainability challenges, emphasizing the need for high-integrity carbon finance and the integration of new data and technologies to support nature-based solutions. He concluded with insights into the BeZero Carbon Rating system, which evaluates carbon efficacy across various projects worldwide and highlights the need for reliable ratings to ensure the credibility of carbon markets.
David Roy [MSU] detailed the work of the GOFC-GOLD Fire Implementation Team, which focuses on improving the accuracy and utility of satellite-based fire monitoring. The team is working to enhance global fire observation requirements, particularly for small fires and those with low Fire Radiative Power, which are often underrepresented in current datasets. Roy emphasized the need for continuous development and validation of satellite-derived fire products, including a robust quality assurance framework. The team advocates for standardized methods to validate fire data and harmonize information from various satellite missions to create a more comprehensive global fire record. Roy also highlighted the need for new satellite missions with advanced fire detection capabilities and the use of machine learning to improve fire modeling and data accessibility to provide more accurate and actionable data for global change research and fire management.
Alexandra Tyukavina [UMD] presented on Land Product Validation (LPV) subgroup of the Committee on Earth Observation Satellites (CEOS) Working Group on Calibration and Validation (WGCV). The LPV is focused on updating land cover validation guidelines, incorporating new literature and data from the past 20 years. Tyukavina emphasized the need for rigorous accuracy assessment in land cover studies, highlighting the need to improve methods and reporting as well as accuracy. She also discussed the outcomes of a NASA-sponsored joint cropland validation workshop co-hosted by CEOS and GEOGLAM, which aimed to set minimum requirements for cropland validation and develop community guidelines. Tyukavina concluded her presentation with a call for reviewers to assist in updating these guidelines.
LCLUC Program Crosswalks
The Crosswalks, a LCLUC program, featured six presentations. Frederick Policelli [GSFC] presented on the CSDA program, which supports the ESD by acquiring and utilizing commercial, small-satellite data to enhance Earth science research. Launched as a pilot in November 2017, the program became a sustained effort in 2020, transitioning from Blanket Purchase Agreements to Indefinite-Delivery, Indefinite-Quantity contracts for better data management. The CSDA also introduced a tiered End User License Agreement for data usage and focuses on long-term data preservation and broad access. Policelli described how program participants collaborate with U.S. government agencies and international partners, adhering to the 2003 U.S. Commercial Remote Sensing Policy. He discussed recent developments, which include onboarding new commercial data vendors and expanding the program’s capabilities.
Jacqueline Le Moigne [ESTO] provided details on NASA’s Earth Science Technology Office’s (ESTO), Advanced Information Systems Technology (AIST) program and its development of Earth System Digital Twins (ESDT). She explained that ESDTs are intended to be dynamic, interactive systems that replicate the Earth’s past and current states, forecast future states, and assess hypothetical scenarios. They should integrate continuous data from diverse sources, utilize advanced computational and visualization capabilities, and rely heavily on machine learning for data fusion, super-resolution, and causal reasoning. Le Moigne added that ESDTs enhance our understanding of Earth systems, their interactions, and applications, particularly in the context of climate change. She highlighted various use cases (e.g., wildfires, ocean carbon processes, the water cycle, and coastal zones) demonstrating the potential of ESDTs to support decision-making and policy planning.
Roger Pielke [University of Colorado, Boulder] discussed the critical need to incorporate land-use data into weather forecasts and climate models to improve understanding of and address climate change. He emphasized the distinction between weather and climate, explaining that climate is dynamic and influenced by both natural and human factors. Pielke critiqued the focus of the approach of the Intergovernmental Panel on Climate Change (IPCC) on carbon dioxide (CO2) emissions as the primary driver of climate change, arguing that LCLUC should be considered as an equally important climate forcing. He illustrated how changes in land cover, such as in Florida and the Great Plains, can significantly impact local and regional climate, sometimes rivaling the effects of CO2. Pielke called for integrating land-use data into climate models across all scales, suggesting that NASA’s programs could lead in this effort to enhance climate forecasting and policymaking.
Brad Doorn [NASA HQ—Program Manager, NASA’s Earth Action Agriculture Program] presented an overview of the program’s status and strategic direction. He emphasized the importance of partnerships, particularly with the USDA, in advancing initiatives like Climate Smart Agriculture. NASA’s role in global food security and supply chain monitoring was highlighted through the activities of NASA’s Harvest and Acres, agriculture and food security consortia, both of which enable collaborative research to codevelop data-driven products and services and enhance predictive models to meet end-user needs. Doorn stressed the need for strong collaborations with the private sector, non-governmental organizations, and other space agencies to accelerate the development of agricultural solutions. He also highlighted the significance of integrating NASA’s capabilities in weather, water, and crop monitoring systems to provide comprehensive tools for stakeholders. Doorn explained that the program aims to bridge gaps between NASA’s observations and practical applications in agriculture, leveraging tools, such as the Global Crop Monitor, and integrating predictive capabilities for improved future planning.
Rachel Paseka [NASA HQ] presented on NASA’s open science funding opportunities with a focus on the ROSES F.7 element, which supports widely used open-source software tools, frameworks, and libraries within the NASA science community. She described the program, which offers two types of awards: Foundational Awards for projects that impact multiple divisions and Sustainment Awards for those affecting one or more divisions of the Science Mission Directorate. Foundational Awards are cooperative agreements lasting up to five years. Sustainment Awards can be grants or cooperative agreements lasting up to three years. Paseka also emphasized the importance of open science, highlighting various tools, data challenges, and collaborative efforts, including artificial intelligence (AI) models for tasks (e.g., flood detection and burn scar mapping). She concluded with an introduction of the Science Explorer (SciX) digital library and the Science Discovery Engine, both of which facilitate access to NASA’s open science data and research.
Alex de Sherbinin [SocioEconomic Data and Applications Center (SEDAC), Center for InternationalEarth Science Information Network (CIESIN), Columbia University] provided an overview of datasets and research related to climate risk, social vulnerability, and environmental change. de Sherbinin outlined the SocioEconomic Data and Applications Center (SEDAC) mission areas, which include population land-use and emissions, mitigation, vulnerability and adaptation, hazard vulnerability assessment, poverty and food security, and environment and sustainable development. He highlighted key SEDAC datasets (e.g., LCLUC and Urban and Settlements Datasets) and their use in analyses. SEDAC data and services are accessible via tools, such as Global Forest Watch and Google Earth Engine. de Sherbinin also covered recent research citations, the impact of studies on biodiversity and urban changes, and SEDAC’s contributions to open science and training initiatives. He also emphasized the importance of integrating remote sensing data with social and health sciences for comprehensive environmental analysis.
DAY THREE
The third day of the meeting focused on satellite missions and data product updates and a LCLUC program feedback session on emerging science directions.
Landsat Mission Updates
Chris Neigh [GSFC—Landsat 9 Project Scientist] provided an overview of the status of the current Landsat missions that are in orbit (L7, L8, and L9]. He reported that all L9 Level-1 requirements have now been met and exceeded. OLI-2, the updated sensor for L9, transmits data at 14 bits compared to the L8 12-bit transmission, allowing for finer data resolution. OLI-2 offers a 25–30% improvement in the signal-to-noise ratio for dark targets, leading to enhanced data quality. The Thermal Infrared Sensor on L9 (TIRS-2) has also been improved over TIRS on L7 and L8, to mitigate stray light issues, enhancing the reliability of thermal data. Additionally, OLI-2 supports better atmospheric corrections through split window techniques using both of its channels. With two operational observatories, L8 and L9, equipped with advanced radiometry, data is provided every eight days, ensuring consistent and precise Earth observation capabilities. The radiometric and geometric performance of L9 is excellent from a Calibration/Validation (Cal/Val) perspective.
While all systems are nominal for L8 and L9, Neigh reported that L7 is nearing the end of its operational life. He stated that the Landsat Cal/Val team will continue its work for the duration of the mission as a joint USGS–NASA effort. He also highlighted the need for a global Analysis Ready Data framework and the development of proxy and simulated datasets to support the next generation of Landsat missions. Neigh ended by reporting that opportunities exist for scientists to share their high-profile, Landsat-based research through the program’s communications team.
Bruce Cook [GSFC—Landsat Next Project Scientist] provided an update on the Landsat Next mission, an ambitious extension of the Landsat Program under the Sustainable Land Imaging (SLI) program, which will be a joint effort by NASA and the USGS. Cook explained that this mission aims to greatly enhance Earth observation by launching three identical satellites, each equipped with advanced Visible Shortwave Infrared (VSWIR) and Thermal Infrared (TIR) instruments. He described how the Landsat Next constellation will improve the temporal revisit time to six days – a major advancement from the 16-day interval of L8 and L9. In order to achieve this revisit time improvement, each satellite will carry a Landsat Next Instrument Suite (LandIS) that will capture 21 VSWIR and five thermal infrared bands, which will have better spatial resolutions compared to previous Landsat missions. It will have ground sample distances of 10–20 m (33–66 ft) for visible, near infrared, and shortwave infrared bands and 60 m (197 ft) for atmospheric visible SWIR and thermal infrared bands.
Cook continued with details on LandIS, stating that Landsat Next will record 26 bands in total – 15 more than the currently active L8 and L9 missions. The LandIS will include refined versions of the 11 Landsat “heritage” bands to ensure continuity, five new bands similar to the ESA’s Copernicus Sentinel-2 mission for improved data integration, and 10 new spectral bands to meet evolving user needs and applications. Additionally, Landsat Next will have a water vapor band for atmospheric correction without needing data from other satellites. LandIS will collect all bands nearly simultaneously, reducing illumination variations between bands and aiding in cloud detection and the generation of multispectral surface reflectance and thermal emission products (e.g., evapotranspiration).
Cook said that Landsat Next is in Phase A of its mission life cycle. The current focus is on defining science requirements and converting them into specific hardware and system designs. He said that this phase is crucial for setting up the subsequent phases. Phase B will involve preliminary design and technology completion, and later phases leading to the final design, fabrication, and launch of the satellites. He ended by emphasizing that the introduction of a new reference system and a lower orbit will further enhance the satellites’ ability to capture high-quality data, leading to a significant advancement in Earth observation technology.
Harmonized Landsat–Sentinel Project Update
Junchang Ju [GSFC] discussed the Harmonized Landsat Sentinel-2 (HLS) project, which aims to integrate data from the L8, L9, Sentinel-2A, and Sentinel-2B satellites for more frequent and detailed Earth observations. Currently the MODIS climate modeling grid data is used for atmospheric correction – see Figure 4. The newer HLS version will use VIIRS-based water vapor and ozone fields instead of MODIS data for atmospheric correction using the land surface reflectance code. Ju explained how HLS adopts the Military Grid Reference System used by Sentinel-2. HLS V2.0 corrects a mistake in view angle normalization of earlier versions (V1.3 and V1.4). Atmospherically corrected data from Hyperion (an instrument on NASA’s Earth Observing–1 extended mission) is used to make bandpass adjustments. A temporally complete global HLS V2.0 dataset has been available since August 2023. He also highlighted the availability and access of HLS data through various platforms – e.g., EarthData and WorldView, in Amazon Web Services and the project’s future plans, such as enhancing vegetation indices, cloud mask improvements, and 10-m (33-ft) improved resolution product.
Figure 4. Sentinel-2B image over the Baltimore-Washington area on April 7, 2022 [left]. Example true color images of top of atmospheric reflectance and the corresponding HLS surface reflectance are shown [right]. The atmospheric ancillary data used in the surface reflectance derivation was from the MODIS Climate Modeling Grid (CMG) data before the transition to VIIRS was implemented.
Figure Credit: Junchang Ju (GSFC)
NISAR Update
Gerald Bawden [NASA HQ—NISARProgram Scientist] delivered a presentation about the NISAR mission, which is a collaborative effort between NASA and the ISRO. He explained that NISAR will be a dual-frequency Synthetic Aperture Radar satellite using 24-cm (9-in) L-band and 10-cm (4-in) S-band radar frequencies. This dual-frequency approach will enable high-resolution imaging of Earth’s surface, offering near-global land and ice coverage with a 12-day repeat cycle for interferometry and approximately 6-day coverage using both ascending and descending orbits. The mission’s goals include providing valuable data to understand and manage climate variability, carbon dynamics, and catastrophic events (e.g., earthquakes). Specific applications include monitoring deformation, measuring ice sheet velocities, observing sea-ice deformation, and assessing biomass and crop disturbances. Bawden discussed NISAR’s data products, which will include raw radar data (Level-0) and geocoded single-look complex images and multi-look interferograms (Level-2). He stated that these data products will be crucial for various research and practical applications, including ecological forecasting, wildfire management, resource management, and disaster response. NISAR’s data will be openly accessible to the global scientific community through the Alaska Satellite Facility Data Active Archive Center. Initially planned for early 2024, the NISAR launch has been delayed to 2025. Bawden reported that NISAR will undergo a three-month commissioning phase after launch – before starting science operations. He also emphasized NASA’s commitment to open science, with NISAR’s data processing software and algorithms being made available as open-source tools, accompanied by training resources to facilitate their use.
Land Surface Disturbance Alert Classification System Update
Matthew Hansen [UMD] focused on the Land Surface Disturbance Alert (DIST-ALERT) classification system, designed for near-real-time global vegetation extent and loss mapping. He described the DIST-ALERT system, which uses HLS data, combining inputs from L8, L9, Sentinel-2A, and -2B to achieve a high-revisit rate of approximately 2–3 days at a 30-m (98-ft) resolution. DIST-ALERT operates with a primary algorithm that tracks vegetation loss through time-series analysis of fractional vegetation cover (FVC) and a secondary algorithm that detects general spectral anomalies. The system integrates drone data from various biomes to build a k-nearest neighbors model that is applied globally to predict FVC at the HLS-pixel scale. Hansen explained that DIST-ALERT monitors disturbances by comparing current vegetation fraction against a seasonal baseline, capturing changes such as forest fires, logging, mining, urban expansion, drought, and land conversion. He concluded by highlighting some case studies, including analysis of forest fires in Quebec, Canada, logging in the Republic of Congo, and gold mining in Ghana. He also said that the team released an improved version (V1) in March 2024, following a provisional release (V0) that was operational from February 2023 to February 2024.
State of LCLUC Report
Chris Justice [UMD—LCLUC Program Scientist] provided comments on the current state of the LCLUC program, followed by an open discussion to gather feedback. He emphasized the need for PI’s to effectively communicate their work to the broader community and highlighted the recent LCLUC initiative to create policy-oriented briefs based on research results, demonstrating its relevance to the Earth Science to Action Strategy. Justice acknowledged that challenges lie ahead for the LCLUC program – particularly considering the anticipated resource constraints in the coming year. He noted that the program plans to strengthen its position by forming partnerships with other ESD program elements and increasing involvement across NASA Centers. The program is also emphasizing the use of advanced remote sensing technologies, AI, and deep-learning data analytics, to deliver more precise and actionable insights into land dynamics contributing to better decision-making and policy development in land management and environmental conservation.
Justice also suggested the need for better integration between different scientific fields (i.e., between LCLUC and climatology, climate mitigation, and adaptation) to enhance interdisciplinary research and collaboration. He cited the current program solicitation (e.g., ROSES 2024 A.2) as an example of this integration and the recent IDS solicitation in ROSES 2022 A.28. Justice reminded participants that the solicitation focuses on collaborating with AIST to develop Land Digital Twins that incorporate available remote sensing data time series as non-static boundary conditions in weather forecast and climate models. Improvements in model forecasts and climate simulations will highlight the importance of accounting for LCLUC in these models – advancing the goals of the IPCC.
Conclusion
Garik Gutman concluded the meeting by summarizing key points raised about data management strategies, educational outreach efforts, LCLUC research outside the U.S., and current and upcoming projects. He highlighted that the program requires PIs to provide metadata for data products generated under NASA-funded projects, ensuring these resources are freely and openly accessible to the scientific community. Gutman acknowledged the challenges of conducting research and fieldwork in foreign countries due to funding and, at times, security issues, but praised the PIs for their efforts to expand the program globally. He also noted the program’s outreach efforts, which include engaging PIs, collaborators, and interested parties through its website, newsletters, webinars, and policy briefs. LCLUC emphasizes the importance of effectively communicating research results and encourages researchers to share their findings via NASA’s Earth Sciences Research Results Portal to enhance visibility among leadership and communication teams.
Gutman ended his presentation by providing details about forthcoming meetings in the Philippines, South Korea, and Turkey, as well as workshops scheduled for 2024, which will involve various stakeholders in the LCLUC community and are vital for fostering collaboration and advancing the program’s goals. He concluded by recognizing the contributions of long-term supporters and collaborators, reaffirming the program’s ongoing commitment to advancing Earth observation and land-use science.
Overall, the 2024 LCLUC meeting was highly successful in fostering collaboration among researchers and providing valuable updates on recent developments in LCLUC research. The exchange of ideas, integration of new data products, and discussions on emerging science directions were particularly impactful, contributing to the advancement of the LCLUC program’s goals.
Krishna Vadrevu NASA’s Marshall Space Flight Center krishna.p.vadrevu@nasa.gov
Meghavi Prashnani University of Maryland, College Park meghavi@umd.edu
Christopher Justice University of Maryland, College Park cjustice@umd.edu
Preparations for Next Moonwalk Simulations Underway (and Underwater)
An equal collaboration between NASA and the Indian Space Research Organisation, NISAR will offer unprecedented insights into Earth’s constantly changing land and ice surfaces using synthetic aperture radar technology. The spacecraft, depicted here in an artist’s concept, will launch from India.
NASA/JPL-Caltech
A Q&A with the lead U.S. scientist of the mission, which will track changes in everything from wetlands to ice sheets to infrastructure damaged by natural disasters.
The upcoming U.S.-India NISAR (NASA-ISRO Synthetic Aperture Radar) mission will observe Earth like no mission before, offering insights about our planet’s ever-changing surface.
The NISAR mission is a first-of-a-kind dual-band radar satellite that will measure land deformation from earthquakes, landslides, and volcanoes, producing data for science and disaster response. It will track how much glaciers and ice sheets are advancing or retreating and it will monitor growth and loss of forests and wetlands for insights on the global carbon cycle.
As diverse as NISAR’s impact will be, the mission’s winding path to launch — in a few months’ time — has also been remarkable. Paul Rosen, NISAR’s project scientist at NASA’s Jet Propulsion Laboratory in Southern California, has been there at every step. He recently discussed the mission and what sets it apart.
NISAR Project Scientist Paul Rosen of NASA’s Jet Propulsion Laboratory first traveled to India in late 2011 to discuss collaboration with ISRO scientists on an Earth-observing radar mission. NASA and ISRO signed an agreement in 2014 to develop NISAR.
NASA/JPL-Caltech
How will NISAR improve our understanding of Earth?
The planet’s surfaces never stop changing — in some ways small and subtle, and in other ways monumental and sudden. With NISAR, we’ll measure that change roughly every week, with each pixel capturing an area about half the size of a tennis court. Taking imagery of nearly all Earth’s land and ice surfaces this frequently and at such a small scale — down to the centimeter — will help us put the pieces together into one coherent picture to create a story about the planet as a living system.
What sets NISAR apart from other Earth missions?
NISAR will be the first Earth-observing satellite with two kinds of radar — an L-band system with a 10-inch (25-centimeter) wavelength and an S-band system with a 4-inch (10-centimeter) wavelength.
Whether microwaves reflect or penetrate an object depends on their wavelength. Shorter wavelengths are more sensitive to smaller objects such as leaves and rough surfaces, whereas longer wavelengths are more reactive with larger structures like boulders and tree trunks.
So NISAR’s two radar signals will react differently to some features on Earth’s surface. By taking advantage of what each signal is or isn’t sensitive to, researchers can study a broader range of features than they could with either radar on its own, observing the same features with different wavelengths.
Is this new technology?
The concept of a spaceborne synthetic aperture radar, or SAR, studying Earth’s processes dates to the 1970s, when NASA launched Seasat. Though the mission lasted only a few months, it produced first-of-a-kind images that changed the remote-sensing landscape for decades to come.
Our data products will fit the needs of users across the mission’s science focus areas — ecosystems, cryosphere, and solid Earth — plus have many uses beyond basic research like soil-moisture and water resources monitoring.
We’ll make the data easily accessible. Given the volume of the data, NASA decided that it would be processed and stored in the cloud, where it’ll be free to access.
How did the ISRO partnership come about?
We proposed DESDynI (Deformation, Ecosystem Structure, and Dynamics of Ice), an L-band satellite, following the 2007 Decadal Survey by the National Academy of Sciences. At the time, ISRO was exploring launching an S-band satellite. The two science teams proposed a dual-band mission, and in 2014 NASA and ISRO agreed to partner on NISAR.
Since then, the agencies have been collaborating across more than 9,000 miles (14,500 kilometers) and 13 time zones. Hardware was built on different continents before being assembled in India to complete the satellite. It’s been a long journey — literally.
More About NISAR
The NISAR mission is an equal collaboration between NASA and ISRO and marks the first time the two agencies have cooperated on hardware development for an Earth-observing mission. Managed for the agency by Caltech, JPL leads the U.S. component of the project and is providing the mission’s L-band SAR. NASA is also providing the radar reflector antenna, the deployable boom, a high-rate communication subsystem for science data, GPS receivers, a solid-state recorder, and payload data subsystem.
Space Applications Centre Ahmedabad, ISRO’s lead center for payload development, is providing the mission’s S-band SAR instrument and is responsible for its calibration, data processing, and development of science algorithms to address the scientific goals of the mission. U R Rao Satellite Centre in Bengaluru, which leads the ISRO components of the mission, is providing the spacecraft bus. The launch vehicle is from ISRO’s Vikram Sarabhai Space Centre, launch services are through ISRO’s Satish Dhawan Space Centre, and satellite mission operations are by ISRO Telemetry Tracking and Command Network. National Remote Sensing Centre in Hyderabad is primarily responsible for S-band data reception, operational products generation, and dissemination.
The Applied Earth Observations Innovation Partnership (AEOIP) was established in 2018 to facilitate knowledge coproduction and optimization of NASA Earth observations that can be used by natural resource managers for decision making. Through continued iteration and reflection, coproduction brings together stakeholders to share responsibilities and the completion of activities towards a common goal. AEOIP enables strong collaborations between NASA and the U.S. Forest Service (USFS), along with growing participation from U.S. Geological Survey (USGS), Bureau of Land Management (BLM), and other federal land management agencies.
These workshops have been designed to build connections between participants across the research-to-applications spectrum with subject matter experts from a variety of federal agencies and other affiliations to continue to promote interagency collaboration within the Earth Observations (EO) applications field. This goal is accomplished using interactive panels and guided discussion sessions that highlight new tools and techniques, promote NASA EO data product uptake, and foster connections between data providers and data users.
2024 Workshop Overview
The most recent AEOIP workshop took place April 23–25, 2024, with a hybrid format. The in-person participants met in Ann Arbor, MI. The three-day event had a similar structure to its predecessors but with a wildland fire management theme. Altogether, 135 people participated in the workshop, with 77 attending in person and 58 virtually – see Photo 1.
Photo 1. Participants at the 2024 AEOIP workshop.
Photo credit: AEOIP
Meeting Objectives
The workshop objectives were to:
meet AEOIP’s mission by providing a forum for building new relationships among Earth observations data providers, users, and stakeholders;
gather and/or codevelop “shovel-ready” ideas to better leverage Earth observations to meet science and management priorities of U.S. land and natural resource management agencies;
gather needs for and/or develop educational materials to support the use of existing EO training resources for fire management; and
gather ideas for the 2025 workshop and other AEOIP activities.
Breakout Sessions
A large segment of this workshop was dedicated to four concurrent topical breakout sessions – referred to in this report as Breakout Sessions A–D. The topics covered in each breakout session are listed below, along with the name(s) of those who facilitated discussion.
Breakout SessionA: Fuels, Wildland Fire Emissions, Carbon & Climate – Andy Hudak [USFS] and Edil Sepulveda Carlo [NASA’s Goddard Space Flight Center (GSFC)/Science Systems and Applications Inc. (SSAI)];
Breakout Session B: Prescribed Fire Planning & Management – Nancy French [Michigan Tech Research Institute (MTRI)], Birgit Peterson [USGS], and Jessica Meisel [University of Idaho];
Breakout Session C:Fractional Vegetation Cover Products & Decision Making – Tim Assal and Jake Slyder [both U.S. Department of Interior, BLM], and Liz Hoy and Amanda Armstrong [both at GSFC]; and Alexis O’Callahan [University of Arkansas].
Breakout Session D: Post-fire Effects & Recovery: Assess, Predict, Remediate, and Monitor – Mary Ellen Miller [MTRI].
All of the breakout groups met on each day of the meeting. On the morning of the first day, the facilitators of each group gave brief “elevator pitches” about each breakout topic, and participants selected a topic for focus. After that, a block of time each day was dedicated to breakout activities and discussions. Participants were asked to focus on different aspects of the topic each day. In the afternoon of the first day, each group focused on identifying needs and challenges in the area being discussed – with a brief report-out at the end of the day. On the afternoon of the second day, the focus was on data availability and solutions – i.e., finding ways to overcome obstacles to making data more readily available to users – again with a brief report- out at the end of the day. On the morning of the third day, there were topical presentations. Each group worked to synthesize their three days of discussions and chose a representative to give a summary report during the closing plenary later that morning.
Workshop Summary
The remainder of this article presents highlights from each day of the workshop. This includes the most important presentations given during the meeting and those given during the breakout sessions. The report also includes highlights from training breakouts given on the second day of the workshop and a summary of a prescribed fire field trip, which took place the day before the workshop and visited two locations – see Optional “Field Trip” for AEOIP Workshop Participants to learn more.
Optional “Field Trip” for AEOIP Workshop Participants
On April 22, 2024, an optional field trip was offered that featured two sites demonstrating prescribed fire in Michigan. For the first stop on the trip, Kevin Butler [Washtenaw County—Natural Areas Preservation Program Stewardship Supervisor] gave a tour of a prescribed fire site in Park Lyndon, a county park in the northwest part of Washtenaw County, MI. The park is being restored to maintain native species using prescribed fire as invasive species control. The intent of these efforts is to restore oak meadows and preserve over 500 species of plants across fens, marshes, ponds, forest, and prairie lands.
On the second leg of the trip, Tina Stephens [City of Ann Arbor—Volunteer and Outreach Coordinator] led a tour of Furstenberg Nature Area, in the city of Ann Arbor, MI. She highlighted the importance of prescribed burning to achieve ecological benefits. The 0.15-km2 (38-acre) park contains wetlands, woodlands, prairie, and oak savanna. Since the mid-1990’s, Natural Area Preservation staff and volunteers have maintained those ecosystems through controlled burns and invasive shrub removal. The second tour stop included a small prescribed fire demonstration – see Photo 2.
Photo 2. Ann Arbor park staff conduct a prescribed fire demonstration for workshop participants during the Furstenberg Nature Area tour portion of the AEOIP field trip.
Photo credit: Joseph Paki
DAY ONE
On the first day, Kira Sullivan-Wiley [Pew Institute] gave a plenary presentation, in which she discussed the value of coproduction, which in the context of AEOIP can be described as honoring the generative capacity of others as a means of optimizing the use of Earth by natural resource managers for decision making – see Photo 3. The benefits of this approach include cost reduction, tracking new ideas, and empowering marginalized voices.
The first block of breakout sessions also occurred during the afternoon of the first day, along with a short report-out. In light of the keynote discussion on coproduction, deliverables from this meeting’s breakout sessions can be seen as coproduced, new or improved conduits between NASA and land-managing entities.
After the keynote, representatives of government agencies (NASA, USFS, and BLM) presented their respective agency’s perspectives. The manager of a nearby state park in Michigan followed with a local perspective. A series of short presentations in the late afternoon featured various program highlights from NASA’s Earth Science Division, which are not detailed in this report – see workshop agenda for list of programs and speakers.
Notable Presentations
In addition to Kira Sullivan–Wiley’s keynote (described above), Christina Moats-Xavier [NASA Headquarters, Earth Action Program—Program Manager for Mission Engagement] shared NASA’s perspective, focusing on NASA’s Earth Science-to-Action strategy, which aims to increase the impact of scientific data. NASA’s Applied Science Program is now included under the broader umbrella of the new Earth Action program element of NASA’s Earth Science Division. This strategy has three pillars: 1) scaling existing efforts; 2) building bridges; and 3) focusing on the user. By collaborating with NASA, AEOIP can address real-world challenges to develop solutions that benefit society. Overall, the presentations on the first day highlighted the importance of collaborative, user-centered approaches and community engagement in addressing environmental challenges.
Everett Hinkley and Frenchy Morisette [both USFS] provided a practitioner’s perspective. They discussed USFS efforts to address climate adaptation, wildfire management, and incorporation of Indigenous traditional ecological knowledge. They also emphasized the application of artificial intelligence/machine learning (AI/ML) for mapping and remote sensing tools.
Both Jake Slyder and Tim Assal described their respective government agency’s management of vast (mostly western) land areas and use of remote sensing for post-fire emergency stabilization and integration with the Assessment, Inventory, and Monitoring (AIM) program.
Kevin Butler offered more of a local perspective as he discussed land stewardship in Michigan. He emphasized the importance of community involvement and respecting natural ecosystems, especially fire-dependent ones, at the local level.
Photo 3. Kira Sullivan-Wiley [Pew Institute] presents on co-production of knowledge during the first day’s plenary session.
Photo credit: AEOIP
DAY TWO
The presentations on the second day of the workshop highlighted the opportunities that Earth observing satellite data presents for natural resource management applications. Five presenters contributed to the panel discussion, titled “Communicating and Soliciting End User Needs: Past, Present and Future.” The second – longer – block of breakout sessions also occurred with a short report-out at the end of the day. A poster session ran concurrently with the report-outs. While this session is not described in this report, it afforded participants an opportunity to showcase their Earth observation related projects and/or interact with their peers. Highlights from the day follow below.
Notable Presentations
Pontus Olafsson [NASA’s Marshall Space Flight Center] and Natasha Sadoff [NASA HQ—Satellite Needs Program Manager] presented on the Satellite Needs Working Group (SNWG), which provides a coordinated approach to identify and communicate federal satellite Earth observation needs and develop solutions based on Earth observation data. The speakers explained that as part of this effort, SNWG facilitates a biannual survey to all civilian federal agencies. SNWG provides federal agencies a path to coordinate Earth observing needs and a mechanism to develop actionable solutions for decision makers. Solutions cover thematic areas, including air quality, land use/land cover, and water resources. They noted that NASA is also making a greater effort to engage with agency partners in the co-development of new solutions that are useful, accessible, and actionable.
Alison York [University of Alaska Fairbanks] spoke about the Joint Fire Science Program (JFSP) and Fire Science Exchange Network (FSEN). JFSP’s main function is to maintain and grow a data repository and community based on fuels, fire behavior, fire ecology, and human dimensions. The goal is to help enable informed, actionable change by policy makers and land managers with the best available scientific support. York then discussed the FSEN, which acts as a mechanism to collate research needs from a collection of regional fire exchanges. The syntheses of data and data needs provides more effective understanding and management of fire.
Training Breakout Session Takeaways
On the second day, the four breakout sessions met, beginning with four short (25-minute) trainings. The speakers each gave half-hour presentations, which they repeated twice during the hour dedicated to the training breakouts, allowing participants to engage in two of the training breakouts if desired.
Pete Robichaud [USFS] discussed training opportunities for modeling post-fire hydrological response using the Water Erosion Prediction Project (WEPP). Soil burn severity is first assessed with remote sensing and then field verified. A subsequent soil burn severity map can be created to give details on physical features, e.g., ash color, ash depth, fine roots, soil structure, water repellency, and ground cover. This resource can be used to create a risk assessment table of probability and consequence parameters. Following the risk assessment, the Forest Service Water WEPP suite of tools can be used to model the landscape. The WEPP suite includes both hillslope and watershed modeling tools. The final step in the Burned Area for Emergency Response (BAER) program is to implement and monitor solutions.
Rupesh Shretha [Oak Ridge National Laboratory (ORNL), Distributed Active Archive Center (DAAC)] discussed the Earth Observing System Data and Information System (EOSDIS) DAACs, which are collocated with centers of science discipline expertise and archive and distribute NASA Earth Science data products. The ORNL DAAC archives and distributes terrestrial ecology data, particularly data from field and airborne campaigns. The Terrestrial Ecology Subsetting & Visualization Services (TESViS) – formerly MODIS–VIIRS subsets tool – provide subsets of satellite data in easy-to-use formats that are particularly valuable for site-based field research. The Ecological Spectral Information System (ECOSIS) integrates spectral data with measurements of vegetation functional traits (i.e., species, foliar chemistry). ECOSIS allows users to submit spectral data and return a citable DOIs. ECOSIS also provides users application programming interface (API)-based methods to retrieve thousands of field spectra.
Jake Slyder discussed the use of remote sensing for efficient resource management over vast tracts of land with limited human and financial resources. He explained that while the vast collection of remotely sensed data makes it challenging to effectively exploit, Google Earth Engine (GEE) has become an important tool in leveraging remotely sensed information to address BLM management questions. The Change and Disturbance Event Detection Tool (CDEDT), a GEE-based application, allows users to detect and develop vector geospatial products to identify changes and disturbances to surface cover between two dates of observations [10 m (~33 ft) resolution] from the European Space Agency’s (ESA) Copernicus Sentinel-2 mission. Slyder said that the Version 2 (V2) beta product includes the National Agriculture Imagery Program (NAIP) and ESA Copernicus Sentinel-1 SAR Imagery. CDEDT supports a range of BLM monitoring applications, including disaster events, energy development, forest disturbances, and seasonal patterns and processes (e.g., vegetation, water cover). The CDEDT tool is publicly available and does not require any license or special software.
DAY THREE
The third day was dedicated to the final block of the breakout sessions and a final plenary, where a representative from each breakout group gave five to seven minute summaries of their discussions throughout the meeting. The overview was followed by a meeting wrap-up and adjournment. The sections below summarize the topical presentations given on day three and encapsulate the three days of discussions.
Breakout Session A: Focus on Carbon
The carbon breakout aimed to inform participants about carbon-related EO initiatives and spark discussion about user needs.
Aaron Piña [USFS] spoke about the Forest Service’s broad base of applied research that spans wildfire weather and behavior to dynamics of the smoke produced – see Photo 2. Recent assessments have been made for wildland fire, controlled burn smoke, and remote air monitors. Piña spoke about Bluesky Playground, a community-driven tool aimed at providing the public with information on fuels and smoke modeling. These data have been used to identify important indicators for fires and fuels (e.g., vertical plume structure).
A group discussion followed Piña’s presentation, during which several participants expressed concerns about the continuity of VIIRS and the other observations that are used in the fusion FRP product. Another topic of discussion was the potential of remotely sensed data to improve the characterization of duff (decaying vegetation) in satellite data products. NASA’s Tropospheric Emissions: Monitoring of Pollution (TEMPO) mission data have also been used to characterize the vertical structure of smoke plumes; however, these efforts have thus far been limited by personnel knowledge gaps as well as raw data formats.
Chris Woodall [USFS] discussed the growing emphasis on carbon metrics for a variety of sectors and applications. The USFS wants to work in tandem with other entities, especially federal organizations, to maximize efforts and workstream. USFS is seen as the in-situ carbon observer, while NASA is the remote sensor, and USGS is the lateral flux assessor. The coproduction of knowledge and data regarding carbon among these agencies is an iterative process. The USFS investment in improved Measurement, Monitoring, Reporting, and Verification (MMRV) of greenhouse gas (GHG), for example, can expand soil and land-use inventories to improve alignment with remote-sensing platforms. Challenges to implementing this cooperative approach to collecting carbon metrics include creating a workflow that incorporates a wealth of existing resources and accruing data from multiple federal agencies concerned with ecosystem carbon management to create scalable GHG knowledge. The coproduction, iteration, and dissemination of knowledge should be a major focus with all interested parties – not just the aforementioned federal agencies.
Sydney Neugebauer [NASA’s Langley Research Center] and Melanie Follette-Cook [GSFC] discussed NASA’s capacity building initiatives, which are aimed at developing and strengthening an organization or community’s skills, abilities, processes, and resources to enable them to survive, adapt, and thrive in a fast changing world. The DEVELOP, Indigenous Peoples Initiative, and SERVIR programs (all under the Earth Action program element) work towards capacity building through co-development projects, collaborative training, and data availability. The NASA Applied Remote Sensing Training (ARSET) program has offered over 100,000 training sessions since it was created in 2009 – primarily to international participants. The trainings are free and virtual for individuals interested in using remotely sensed data in a diverse suite of environmental applications. All content is archived. NASA’s Carnegie-Ames-Stanford Approach (CASA), which has contributed to global carbon dioxide (CO2) sequestration datasets for the past 30-years, will be upgraded to incorporate CO2 fluxes. The NASA cooperative interagency U.S. Greenhouse Gas Center is also looking for feedback on its beta portal.
The group discussions that followed identified and addressed AEOIP needs and questions (e.g., obtaining carbon and smoke emission estimates from prescribed wildfires and ensuring global satellite fire record continuity). Participants also identified the need for near real-time active fire and burned area mapping at medium scale and for continuity of these measurements. The group is interested in engaging federal agency end users to obtain feedback on their capacity to facilitate and elucidate capacity needs. Prominent challenges going forward include preparing for the end of the Terra and Aqua missions, which will include the decommissioning of MODIS, and ensuring the continuity of VIIRS, which is being used to allow for continuity of MODIS data products. One of the greatest unknowns identified was being able to determine wildfire fuel conditions in near-real time, and the ability to constrain estimates of fuel attributes to a focused fire event.
Andy Hudak discussed the diverse coalition of practitioners who manage more than just carbon (e.g., forest health, harvest, fires). Of the diverse group of stakeholders, Indigenous Tribes are at the cutting edge using lidar for carbon assessment. While Forest Inventory and Analysis plots are used for bias correction, they do not provide synoptic coverage for accurate carbon assessments. Lidar and other passive remote sensing satellite data provide a way to address this need. Tree lists are also highly valuable to carbon and forest managers for diverse applications. Application-specific metrics (e.g., timber volume, basal area, and density) can be weighted based on stakeholder priorities, as quantified from stakeholder surveys, to optimize data products.
Sarah Lewis [USFS] explained the needs and applications of Earth observations in a post-fire environment. The information needs to be available quickly, integrated into effective decision-making tools, and delivered in a functional product. Information is needed on water, soils, vegetation recovery, and habitat – all major metrics of interest in a data product. Areas of concern during post-fire management for water quality and erosion control include ash and soil–water transport. In addition, major concerns exist for timely data acquisition and processing, along with the fate and transport mapping of post-fire ash. Data products would benefit from end-user input to optimize relevance and accessibility of decision ready maps, models, and trusted recommendations.
The group identified the need for heavy carbon fuels and duff estimates for ecological modeling, which is critical to achieving a better understanding of smoke and carbon emissions. The heavy carbon fuel and duff estimates may be achieved through multiple means but may be most accessible currently through a new layer in the LANDFIRE database. They also identified the need for more post-fire data for model training and integration of active remote sensing data. Finally, the group identified the need for more regulation and research on prescribed fire emissions and disturbance.
Breakout Session B: Prescribed Fire
This breakout session focused on prescribed fires. Some of the major objectives and needs that emerged from this session were improved access to data, cultivating deeper public trust in the practice, creating networks of future coproduction, and assessing end-user needs, burn maps, and securing funding. The discussions emphasized knowledge and awareness gaps as a major impediment to prescribed fire implementation. Uniform capacity building is an ideal approach to engage stakeholders at a reference level appropriate to their background to optimize equity and efficacy.
Another issue that came up during discussion is that land management professionals do not have the time or resources to stay current with data sources and analysis techniques. The participants suggested the creation of a “Fire Science Library” as an iterative data tool to organize and present fire knowledge in an actionable and streamlined manner for public land managers. The interface would allow practitioners to filter unique categories (e.g., role, scope, region, ecosystem type, weather, agency affiliation) to provide the ability to search, modify, and maintain fire science knowledge as it evolves. This interface would also provide provenance through references to papers, justification for methods, and case studies. The library would guide and streamline data collection, analyses, and interpretation workflows that are needed for holistic prescribed fire planning and monitoring based on tangible needs from fire professionals.
The virtual library tool would provide a user with a fire-science knowledge graph, which is an organized representation of real-world entities and their relationships that could quickly connect fire-related management with current research questions concerning data products, processing methods, and data sources along with references and case studies. Information provided in the knowledge graph would need to be context specific but not overly prescriptive to avoid constraining users to a rigid workflow that is more common in basic data portals. Knowledge graphs are associated with semantic web technology that forms a modern version of a database. The tool establishes relationships between entities that promote new relationship discovery, search, and modification. It also provides a foundation on which other applications can be built, such as prescribed fires in the southeast and incorporating drone data. Focusing on prescribed fire may help to bound the initial product development but leave the door open for eventual expansion for wildfire.
The group identified objectives moving forward, including the need to finalize the main set of prescribed fire management questions (e.g., planning, implementation, pre/post monitoring), establish user personas based on known representatives and gaps, engage the Earth Science Information Partners (ESIP), identify cluster members (e.g., subject matter experts from local and federal agencies, private industry, and academia/research), and investigate additional funding sources. (Clusters are agile working groups within ESIP formed to focus on specific topics.)
Breakout Session C: Fractional Vegetation Cover
This breakout session focused on fractional vegetation cover (FVC) – see Photo 4. The presenters introduced three large FVC assessment efforts, and the participants contributed to a Strengths, Weakness, Opportunities, and Threats (SWOT) analysis of FVC products intended to improve the use of this data by decision makers – see Table.
Photo 4. [left to right] Amanda Armstrong, Elizabeth Hoy [both at Goddard Space Flight Center], and Timothy Assal [Bureau of Land Management] collaborating during the Fractional Vegetation Cover Breakout.
Photo credit: AEOIP
Tim Assal discussed the BLM’s Assessment Inventory and Monitoring (AIM) strategy. He explained that AIM has nearly 60,000 monitoring locations across the terrestrial uplands, aquatic systems, and riparian and wetland habitat of the U.S., and the data collected are being used for monitoring and restoration activities. Assai added that integration of remote sensing data with field plot data enables the generation of continuous datasets (e.g., FVC that can relate field plot-level indicators to those based on remote-sensing). He also reported that FVC data are currently being used to address numerous management decisions.
Sarah McCord [USDA] discussed V3 of the Rangeland Analysis Platform (RAP). McCord explained that V3 uses vegetation cover and rangeland production data to monitor these parameters. The model also uses species composition data. She explained that there are approximately 85,000 training/validation locations across the U.S. that have been incorporated into the modeling process. She said that enhancements to future versions of RAP are expected as data from new satellite instruments, field plots, and deep learning (i.e., application of AI/ML techniques) are all incorporated into the model. McCord chairs a working group that is actively investigating sources of error and uncertainty within individual and across different FVC products.
Bo Zhou [University of California, Los Angeles (UCLA)] discussed V2 of the Landscape Cover Analysis and Reporting Tool (LandCART). V3 will be different and coming in the future. He explained that the BLM uses V3 to make legally defensible decisions. He then discussed the training data, which come mostly from AIM. The training dataset includes 71 Level-4 (L4) Ecoregions, as defined by the U.S. Environmental Protection Agency, with at least 100 observations. Zhou noted that these training data are used to define spatial extent, the temporal extent is defined by available satellite imagery, and uncertainty estimates are based on CNN and random forest (RF) machine-learning algorithms.
Strengths • Tools available for accessing and processing data are user-friendly and widely accessible, making it easy to compile, use, and display data for users of all expertise levels across a range of management activities. • Tools provide a comprehensive view of an area, offering both current and retrospective insights that are highly regarded by the restoration community. • Tool format supports integration of new datasets, ensuring inclusivity and consistency over time and space.
Weaknesses • Training data exhibits spatial and temporal biases. • Training data is biased towards federal data, lacking global representation. • Sensors have limitations for both temporal and spatial accuracy.
Opportunities • Managers can use these tools to make informed decisions and evaluate the effectiveness of their treatments. • Additional training (e.g., training in how to process new data types, such as hyperspectral data) could institutionalize remote sensing and reach more end users. • Future expansion of AI/ML techniques and cloud-based services could reduce error, enhance data quality, and increase user reach.
Threats • Stability of funding could threaten continuity of measurements. • Falling into a “one size fits all” mentality could stifle innovation. • Variation in land management organizations’ willingness to update data and lack of cohesion could prevent obtaining full potential of FVC. • Transition from research to operations could hinder collaboration and tool development and weaken the community of practice. • Poor performance, misuse of information, and data sovereignty could diminish the community’s trust in the tools. • Rapid technological advancements could displace smaller businesses.
Table. Results of a Strengths, Weaknesses, Opportunities, and Threats (SWOT) analysis of the current state of Fractional Vegetation Cover (FVC) data analysis tools and techniques.
Breakout Session D: Post-fire Effects and Recovery
This session focused on assessing, predicting, remediating, and monitoring areas in the aftermath of fires. The focus was on “shovel-ready” ideas, such as improving operational soil burn severity maps to connect post-fire ground conditions and soil properties. The participants highlighted the need to leverage information (e.g., active fire thermal data) to better detect changes in post-fire cover and soil properties. Such information would be beneficial to USFS’s Burned Area for Emergency Response (BAER) program as well as to researchers, data providers, decision makers, and community leaders. The group discussed steps that would aid in this collaboration (e.g., incorporating thermal imagery into mapping soil burn severity, developing and validating products, getting first-look data to field teams, monitoring threats by conducting rapid burn severity assessment before official soil burn severity maps are made available, and sharing outputs quickly with decision makers).
The breakout participants also noted the challenge of ash load mapping, which they suggested might be constrained by using information on pre-fire fuels (e.g., biomass, understory, and canopy vegetation) to constrain potential ash production. Derived information products [e.g., Normalized Difference Vegetation Index (NDVI), Leaf Area Index (LAI), LANDFIRE fuels layers, and RAP] may improve this process. The group noted the limitations of the VIIRS instrument for mapping fire duration and soil heating. The group proposed adding supplemental data through the use of National Infrared Operations (NIROPS) raw infrared imagery – see Figure1.
Fire tools currently available – and under consideration for improving maps – include VIIRS active fire data through NASA’s Fire Information for Resource Management System (FIRMS), fire event tracking through NASA’s Earth Information System Fire Event Data Suite (FEDS), the burn severity prediction model at MTRI, and Rapid Differenced Normalized Burn Ratio Mapping at the University of Wisconsin, Madison. The group identified VIIRS L1 image capture to detect smoldering fires as a potential improvement in wildfire characterization. The group also suggested more frequent observations of moderate resolution satellites, GOES Integration [0.5–2 km (0.3–1.2 mi) spatial resolution], and comprehensive field data. They identified possible ways to improve post-fire soil burn severity maps (e.g., information on pre-fire fuels, soil characteristics, and thermal properties, such as fire heating, residence time, spread rate), optical characteristic (e.g., vegetation mortality, ash production), and lidar canopy metrics.
Presently, burn severity is assessed using a simple spectral index derived from remote sensing data, driven by necessity, data access, and computing power. The group presented the need to break this single number into ecologically meaningful components for better post-fire assessment and remediation. Improvements could involve incorporating additional information (e.g., peak soil temperature, heat residence time, and fuel moisture). Coupling atmospheric fire behavior models could address temporal gaps, necessitating high-spatial and temporal resolution thermal data sets.
The participants agreed that future strategies should include monitoring warmer areas and smoldering zones instead of just flaming fronts, as well as exploring temperature differences across burn severities. Additionally, post-fire assessments would benefit from using other spectral bands and post-fire Ecosystem Spaceborne Thermal Radiometer Experiment on Space Station (ECOSTRESS) products. They also added that access to more field information is crucial for scientific post-fire observations. Efforts are underway to make the SBS S123 survey system a national standard, though surveys currently reside with local units that have good record-keeping practices.
Figure 1. Optical [left and right] and thermal [right, overlay] images of participants at the 2024 AEOIP workshop obtained by an unpiloted aerial vehicle (UAV).
Image credit: Colin Brooks
Conclusion
The 2024 AEOIP workshop addressed a wide range of geospatial data tool and training needs and forums. The meeting centered on coproduction of knowledge and community-of-practice building as key needs for the geospatial data topics. Participants identified capacity building – through awareness, accessibility, and utility of data and tools – as the top priority for processing and technological advancement initiatives.
The breakout session topics selected (e.g., carbon concentrations, wildfires, prescribed fires, and landscape dynamics) were chosen to promote dialogue between data users and scientists, leading to plans for action and change in data and tool utility in four areas of interest for land managers. Following the meeting, the organizers submitted a spreadsheet detailing the data and tool needs identified during the breakouts to the Earth Action Program. The SNWG has also been made aware of the most compelling needs that participants identified. The AEOIP believes that by bridging two groups – data users and research and development – it will be possible to bolster user provenance and efficacy of NASA resources moving forward.