NASA Tests Drones to Provide Micrometeorology, Aid in Fire Response
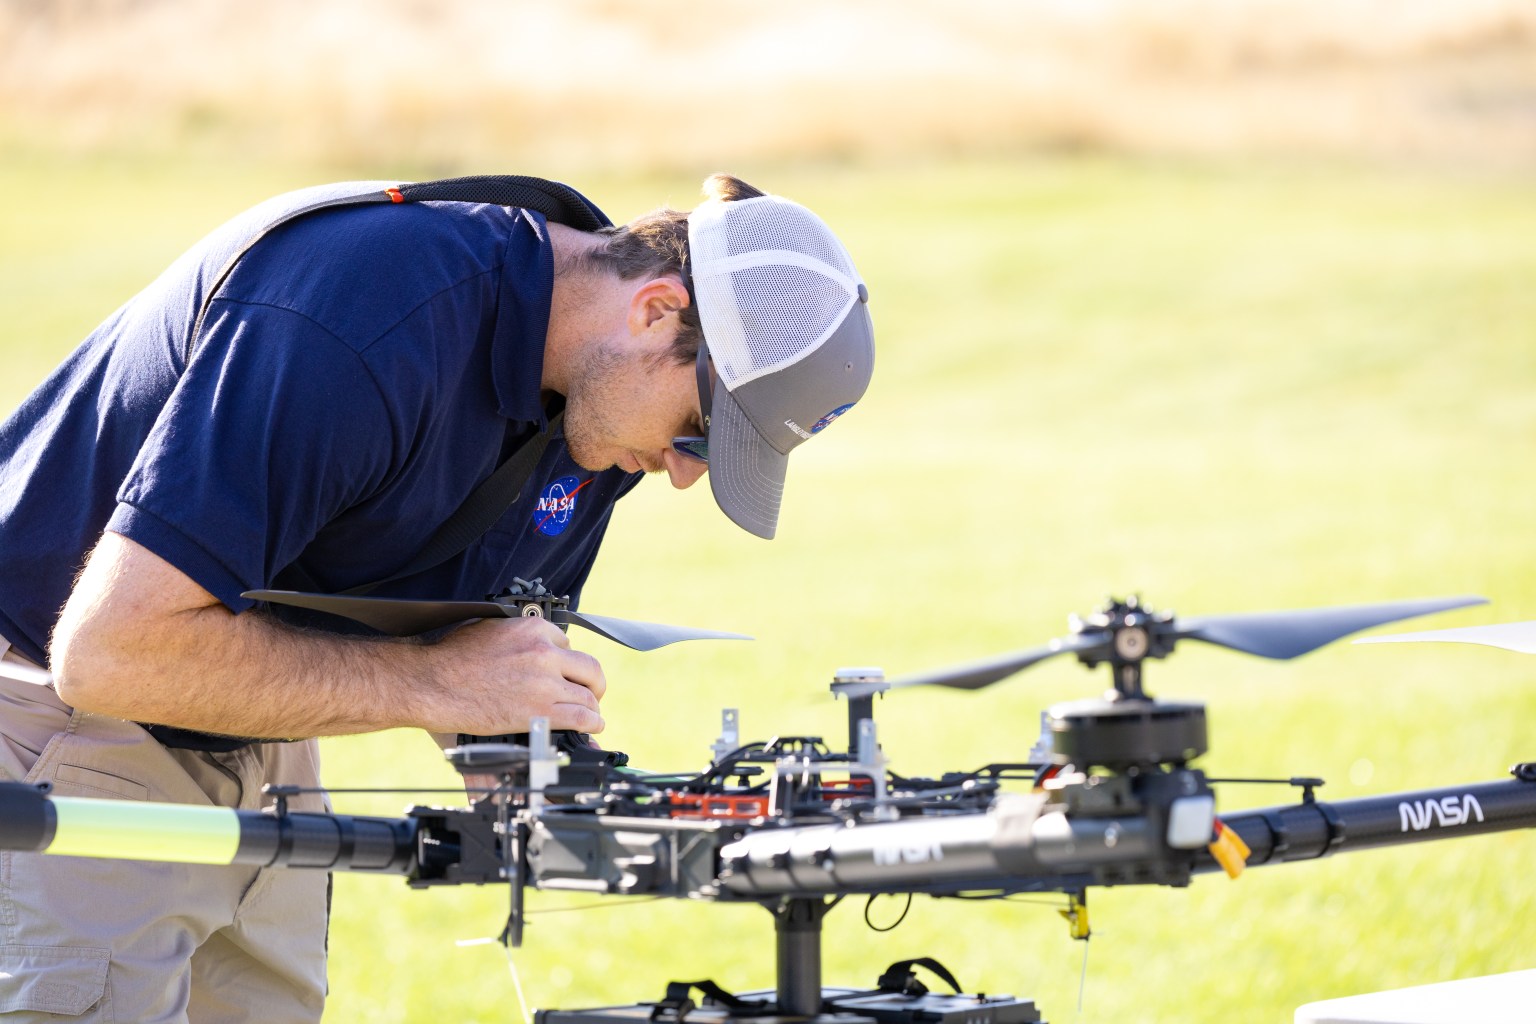
Pilot in command Brayden Chamberlain performs pre-flight checks on the NASA Alta X quadcopter during the FireSense uncrewed aerial system (UAS) technology demonstration in Missoula.
Credits: NASA ARC/Milan Loiacono
In Aug. 2024, a team of NASA researchers and partners gathered in Missoula, to test new drone-based technology for localized forecasting, or micrometeorology. Researchers attached wind sensors to a drone, NASA’s Alta X quadcopter, aiming to provide precise and sustainable meteorological data to help predict fire behavior.
Wildfires are increasing in number and severity around the world, including the United States, and wind is a major factor. It leads to unexpected and unpredictable fire growth, public threats, and fire fatalities, making micrometeorology a very effective tool to combat fire.
This composite image shows the NASA Alta X quadcopter taking off during one of eight flights it performed for the 2024 FireSense UAS technology demonstration in Missoula. Mounted on top of the drone is a unique infrastructure designed at NASA’s Langley Research Center in Hampton,Virginia, to carry sensors that measure wind speed and direction into the sky. On the ground, UAS pilot in command Brayden Chamberlain performs final pre-flight checks.
NASA/Milan Loiacono
The campaign was run by NASA’s FireSense project, focused on addressing challenges in wildland fire management by putting NASA science and technology in the hands of operational agencies.
“Ensuring that the new technology will be easily adoptable by operational agencies such as the U.S. Forest Service and the National Weather Service was another primary goal of the campaign,” said Jacquelyn Shuman, FireSense project scientist at NASA’s Ames Research Center in California’s Silicon Valley.
The FireSense team chose the Alta X drone because the U.S. Forest Service already has a fleet of the quadcopters and trained drone pilots, which could make integrating the needed sensors – and the accompanying infrastructure – much easier and more cost-effective for the agency.
The UAS pilot in command, Brayden Chamberlain, flashes a “good to go” signal to the command tent, indicating that the NASA Alta X quadcopter is prepped for takeoff. Behind Chamberlain, the custom structure attached to the quadcopter holds a radiosonde (small white box) and an anemometer (hidden from view), which will collect data on wind speed and direction, humidity, temperature, and pressure.
NASA/Milan Loiacono
The choice of the two sensors for the drone’s payload was also driven by their adoptability.
The first, called a radiosonde, measures wind direction and speed, humidity, temperature, and pressure, and is used daily by the National Weather Service. The other sensor, an anemometer, measures wind speed and direction, and is used at weather stations and airports around the world.
The two sensors mounted on the NASA Alta X quadcopter are a radiosonde (left) and an anemometer (right), which measure wind speed and direction. The FireSense teams hopes that by giving them wings, researchers can enable micrometeorology to better predict fire and smoke behavior.
NASA/Milan Loiacono
“Anemometers are everywhere, but are usually stationary,” said Robert McSwain, the FireSense uncrewed aerial system (UAS) lead, based at NASA’s Langley Research Center in Hampton, Virginia. “We are taking a sensor type that is already used all over the world, and giving it wings.”
Anemometers are everywhere, but are usually stationary. We are taking a sensor type that is already used all over the world, and giving it wings.
Robert Mcswain
FireSense Uncrewed Aerial System (UAS) Lead
Both sensors create datasets that are already familiar to meteorologists worldwide, which opens up the potential applications of the platform.
Current Forecasting Methods: Weather Balloons
Traditionally, global weather forecasting data is gathered by attaching a radiosonde to a weather balloon and releasing it into the air. This system works well for regional weather forecasts. But the rapidly changing environment of wildland fire requires more recurrent, pinpointed forecasts to accurately predict fire behavior. It’s the perfect niche for a drone.
Left: Steven Stratham (right) attaches a radiosonde to the string of a weather balloon as teammates Travis Christopher (left) and Danny Johnson (center) prepare the balloon for launch. This team of three from Salish Kootenai College is one of many college teams across the nation trained to prepare and launch weather balloons. Right: One of these weather balloons lifts into the sky, with the radiosonde visible at the end of the string.
NASA/Milan Loiacono
“These drones are not meant to replace the weather balloons,” said Jennifer Fowler, FireSense’s project manager at Langley. “The goal is to create a drop-in solution to get more frequent, localized data for wildfires – not to replace all weather forecasting.”
The goal is to create a drop-in solution to get more frequent, localized data for wildfires – not to replace all weather forecasting.
Jennifer Fowler
FireSense Project Manager
Drones Provide Control, Repeat Testing, Sustainability
Drones can be piloted to keep making measurements over a precise location – an on-site forecaster could fly one every couple of hours as conditions change – and gather timely data to help determine how weather will impact the direction and speed of a fire.
Fire crews on the ground may need this information to make quick decisions about where to deploy firefighters and resources, draw fire lines, and protect nearby communities.
A reusable platform, like a drone, also reduces the financial and environmental impact of forecasting flights.
“A weather balloon is going to be a one-off, and the attached sensor won’t be recovered,” Fowler said. “The instrumented drone, on the other hand, can be flown repeatedly.”
The NASA Alta X quadcopter sits in a field in Missoula, outfitted with a special structure to carry a radiosonde (sensor on the left) and an anemometer (sensor on the right) into the air. This structure was engineered at NASA’s Langley Research Center to ensure the sensors are far enough from the rotors to avoid interfering with the data collected, but without compromising the stability of the drone.
NASA/Milan Loiacono
The Missoula Campaign
Before such technology can be sent out to a fire, it needs to be tested. That’s what the FireSense team did this summer.
Smoke from the nearby Miller Peak Fire drifts by the air control tower at Missoula Airport on August 29, 2024. Miller Peak was one of several fires burning in and around Missoula that month, creating a smokey environment which, combined with the mountainous terrain, made the area an ideal location to test FireSense’s new micrometeorology technology.
NASA/Milan Loiacono
McSwain described the conditions in Missoula as an “alignment of stars” for the research: the complex mountain terrain produces erratic, historically unpredictable winds, and the sparsity of monitoring instruments on the ground makes weather forecasting very difficult. During the three-day campaign, several fires burned nearby, which allowed researchers to test how the drones performed in smokey conditions.
A drone team out of NASA Langley conducted eight data-collection flights in Missoula. Before each drone flight, student teams from the University of Idaho in Moscow, Idaho, and Salish Kootenai College in Pablo, Montana, launched a weather balloon carrying the same type of radiometer.
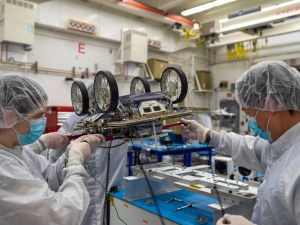
Left: Weather balloon teams from University of Idaho and Salish Kootenai College prepare a weather balloon for launch on the second day of the FireSense campaign in Missoula. Right: NASA Langley drone crew members Todd Ferrante (left) and Brayden Chamberlain (right) calibrate the internal sensors of the NASA Alta X quadcopter before its first test flight on Aug. 27, 2024.
Once those data sets were created, they needed to be transformed into a usable format. Meteorologists are used to the numbers, but incident commanders on an active fire need to see the data in a form that allows them to quickly understand which conditions are changing, and how. That’s where data visualization partners come in. For the Missoula campaign, teams from MITRE, NVIDIA, and Esri joined NASA in the field.
An early data visualization from the Esri team shows the flight paths of weather balloons launched on the first day of the FireSense UAS technology demonstration in Missoula. The paths are color-coded by wind speed, from purple (low wind) to bright yellow (high wind).
NASA/Milan Loiacono
Measurements from both the balloon and the drone platforms were immediately sent to the on-site data teams. The MITRE team, together with NVIDIA, tested high-resolution artificial intelligence meteorological models, while the Esri team created comprehensive visualizations of flight paths, temperatures, and wind speed and direction. These visual representations of the data make conclusions more immediately apparent to non-meteorologists.
What’s Next?
Development of drone capabilities for fire monitoring didn’t begin in Missoula, and it won’t end there.
“This campaign leveraged almost a decade of research, development, engineering, and testing,” said McSwain. “We have built up a UAS flight capability that can now be used across NASA.”
This campaign leveraged almost a decade of research, development, engineering, and testing. We have built up a UAS flight capability that can now be used across NASA.
Robert Mcswain
FireSense Uncrewed Aerial System (UAS) Lead
The NASA Alta X and its sensor payload will head to Alabama and Florida in spring 2025, incorporating improvements identified in Montana. There, the team will perform another technology demonstration with wildland fire managers from a different region.
The FireSense project is led by NASA Headquarters in Washington and sits within the Wildland Fires program, with the project office based at NASA Ames. The goal of FireSense is to transition Earth science and technological capabilities to operational wildland fire management agencies, to address challenges in U.S. wildland fire management before, during, and after a fire.
About the Author
Milan Loiacono
Science Communication Specialist
Milan Loiacono is a science communication specialist for the Earth Science Division at NASA Ames Research Center.
Preparations for Next Moonwalk Simulations Underway (and Underwater)
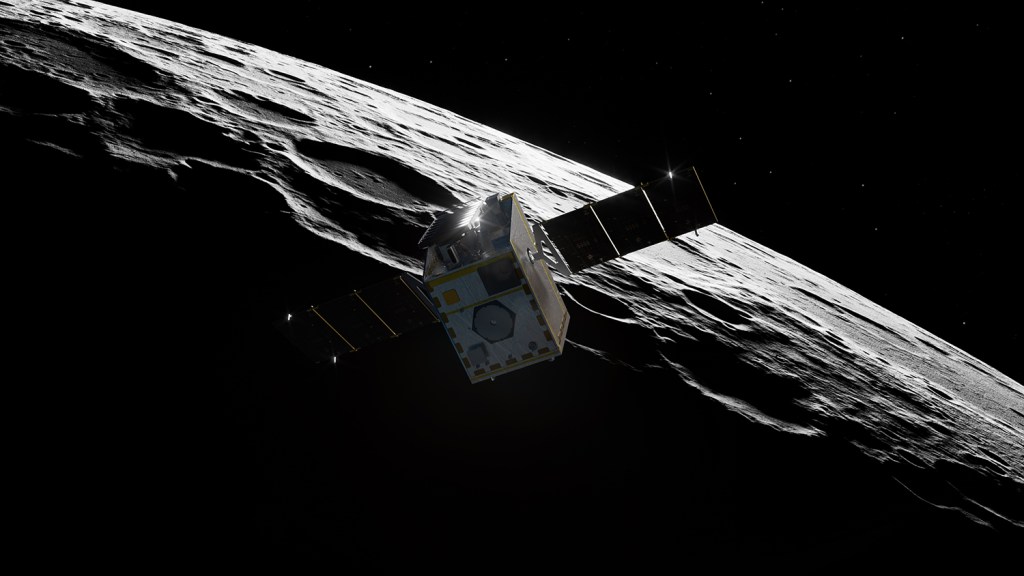
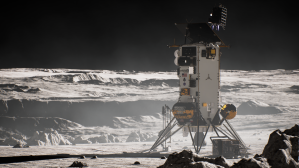
NASA’s Lunar Trailblazer approaches the Moon as it enters its science orbit in this artist’s concept. The small satellite will orbit about 60 miles (100 kilometers) above the lunar surface, producing the best-yet maps of water on the Moon.
Lockheed Martin Space
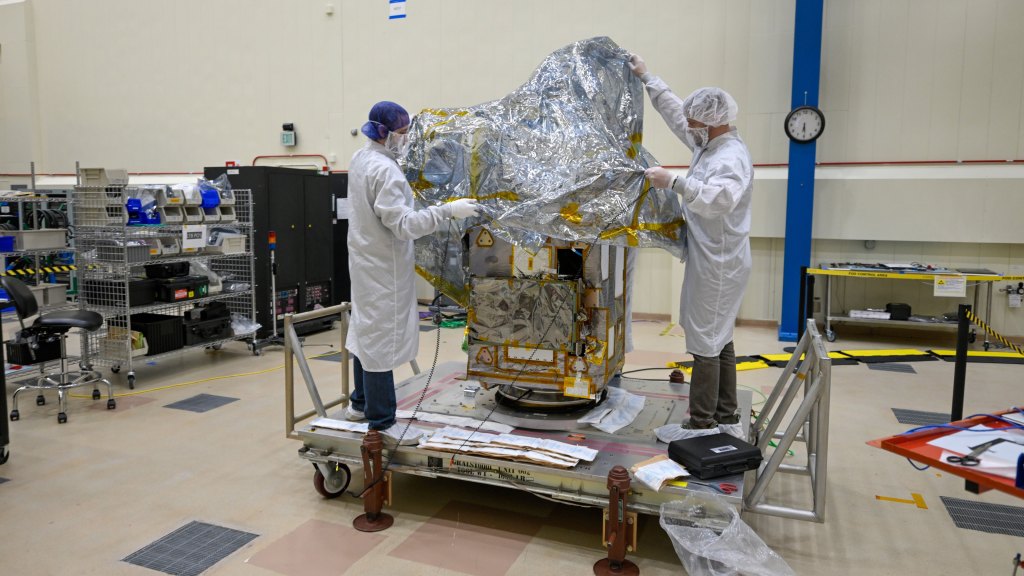
NASA’s Lunar Trailblazer spacecraft gets covered in anti-static wrap before being shipped from Lockheed Martin Space in Littleton, Colorado, to the agency’s Kennedy Space Center in Florida, where it arrived on Jan. 29.
Lockheed Martin Space
Before arriving at the Moon, the small satellite mission will use the gravity of the Sun, Earth, and Moon over several months to gradually line up for capture into lunar orbit.
NASA’s Lunar Trailblazer arrived in Florida recently in advance of its launch later this month and has been integrated with a SpaceX Falcon 9 rocket. Shipped from Lockheed Martin Space in Littleton, Colorado, the small satellite is riding along on Intuitive Machines’ IM-2 launch — part of NASA’s CLPS (Commercial Lunar Payload Services) initiative — which is slated for no earlier than Thursday, Feb. 26, from Launch Complex 39A at the agency’s Kennedy Space Center.
Approximately 48 minutes after launch, Lunar Trailblazer will separate from the rocket and begin its independent flight to the Moon. The small satellite will discover where the Moon’s water is, what form it is in, and how it changes over time, producing the best-yet maps of water on the lunar surface. Observations gathered during its two-year prime mission will contribute to the understanding of water cycles on airless bodies throughout the solar system while also supporting future human and robotic missions to the Moon by identifying where water is located.
Key to achieving these goals are the spacecraft’s two state-of-the-art science instruments: the High-resolution Volatiles and Minerals Moon Mapper (HVM3) infrared spectrometer and the Lunar Thermal Mapper (LTM) infrared multispectral imager. The HVM3 instrument was provided by NASA’s Jet Propulsion Laboratory in Southern California and LTM was built by the University of Oxford and funded by the UK Space Agency.
Lunar Trailblazer’s voyage to the Moon will take between four and seven months, de-pending on the day it launches. This orbital diagram shows the low-energy transfer trajectory of the NASA mission should it launch on Feb. 26, the earliest date in its launch period.
NASA/JPL-Caltech
“The small team is international in scope, which is more typical of larger projects,” said Andy Klesh, Lunar Trailblazer’s project systems engineer at JPL. “And unlike the norm for small missions that may only have a very focused, singular purpose, Lunar Trailblazer has two high-fidelity instruments onboard. We are really punching above our weight.”
Intricate Navigation
Before it can use these instruments to collect science data, Lunar Trailblazer will for several months perform a series of Moon flybys, thruster bursts, and looping orbits. These highly choreographed maneuvers will eventually position the spacecraft so it can map the surface in great detail.
Weighing only 440 pounds (200 kilograms) and measuring 11.5 feet (3.5 meters) wide when its solar panels are fully deployed, Lunar Trailblazer is about the size of a dishwasher and has a relatively small engine. To make its four-to-seven-month trip to the Moon (depending on the launch date) as efficient as possible, the mission’s design and navigation team has planned a trajectory that will use the gravity of the Sun, Earth, and Moon to guide the spacecraft — a technique called low-energy transfer.
“The initial boost provided by the rocket will send the spacecraft past the Moon and into deep space, and its trajectory will then be naturally reshaped by gravity after several lunar flybys and loops around Earth. This will allow it to be captured into lunar orbit with minimal propulsion needs,” said Gregory Lantoine, Lunar Trailblazer’s mission design and navigation lead at JPL. “It’s the most fuel-efficient way to get to where we need to go.”
As it flies past the Moon several times, the spacecraft will use small thruster bursts — aka trajectory correction maneuvers — to slowly change its orbit from highly elliptical to circular, bringing the satellite down to an altitude of about 60 miles (100 kilometers) above the Moon’s surface.
Arriving at the Moon
Once in its science orbit, Lunar Trailblazer will glide over the Moon’s surface, making 12 orbits a day and observing the surface at a variety of different times of day over the course of the mission. The satellite will also be perfectly placed to peer into the permanently shadowed craters at the Moon’s South Pole, which harbor cold traps that never see direct sunlight. If Lunar Trailblazer finds significant quantities of ice at the base of the craters, those locations could be pinpointed as a resource for future lunar explorers.
The data the mission collects will be transmitted to NASA’s Deep Space Network and delivered to Lunar Trailblazer’s new operations center at Caltech’s IPAC in Pasadena, California. Working alongside the mission’s experienced team will be students from Caltech and nearby Pasadena City College who are involved in all aspects of the mission, from operations and communications to developing software.
Lunar Trailblazer was a selection of NASA’s SIMPLEx (Small Innovative Missions for Planetary Exploration), which provides opportunities for low-cost science spacecraft to ride-share with selected primary missions. To maintain the lower overall cost, SIMPLEx missions have a higher risk posture and lighter requirements for oversight and management. This higher risk acceptance allows NASA to test pioneering technologies, and the definition of success for these missions includes the lessons learned from more experimental endeavors.
“We are a small mission with groundbreaking science goals, so we will succeed by embracing the flexibility that’s built into our organization,” said Lee Bennett, Lunar Trailblazer operations lead with IPAC. “Our international team consists of seasoned engineers, science team members from several institutions, and local students who are being given the opportunity to work on a NASA mission for the first time.”
More About Lunar Trailblazer
Lunar Trailblazer is led by Principal Investigator Bethany Ehlmann of Caltech in Pasadena, California. Caltech also leads the mission’s science investigation and mission operations. This includes planning, scheduling, and sequencing of all science, instrument, and spacecraft activities during the nominal mission. Science data processing will be done in the Bruce Murray Laboratory for Planetary Visualization at Caltech. NASA’s Jet Propulsion Laboratory in Southern California manages Lunar Trailblazer and provides system engineering, mission assurance, the HVM3 instrument, and mission design and navigation. Lockheed Martin Space provides the spacecraft, integrates the flight system, and supports operations under contract with Caltech. University of Oxford developed and provided the LTM instrument. Part of NASA’s Lunar Discovery Exploration Program, the mission is managed by NASA’s Planetary Mission Program Office at Marshall Space Flight Center in Huntsville, Alabama, for the agency’s Science Mission Directorate in Washington.
For more information about Lunar Trailblazer, visit:
Researchers found crocodilians, bats, raccoons and other creatures prowling a Florida town’s storm drains, “like something out of ‘Teenage Mutant Ninja Turtles,’” one said.
Startup Canaery is partnering with a US Department of Energy lab to develop neural implants for rats and dogs that are capable of decoding what they smell.
There is a 2 percent chance that seven years from now, “the city destroyer” will hit Earth with the force of an 8-megaton nuclear weapon. Here are its possible impact points.
Filters in water pitchers or under-sink systems capture dangerous chemicals, only for them to be returned to the environment. A researcher from North Carolina is pioneering a new system that could get rid of forever chemicals forever.
Preparations for Next Moonwalk Simulations Underway (and Underwater)
We’ve been talking about this for 2,000 years. Aristotle mentions it. And in our own time, scientists are designing experiments to figure out exactly what’s going on. But there’s no consensus yet.
Here’s what we do know.
The atmosphere isn’t magnifying the Moon. If anything, atmospheric refraction squashes it a little bit. And the Moon’s not closer to us at the horizon. It’s about 1.5 percent farther away. Also, it isn’t just the Moon. Constellations look huge on the horizon, too.
One popular idea is that this is a variation on the Ponzo illusion. Everything in our experience seems to shrink as it recedes toward the horizon — I mean clouds and planes and cars and ships. But the Moon doesn’t do that. So our minds make up a story to reconcile this inconsistency. Somehow the Moon gets bigger when it’s at the horizon. That’s one popular hypothesis, but there are others. And we’re still waiting for the experiment that will convince everyone that we understand this.
So why does the Moon look larger on the horizon? We don’t really know, but scientists are still trying to figure it out.
Preparations for Next Moonwalk Simulations Underway (and Underwater)
Cliffs slope into the ocean in San Simeon, California. All along the state’s dynamic coastline, land is inching down and up due to natural and human-caused factors. A better understanding of this motion can help communities prepare for rising seas.
NASA/JPL-Caltech
The elevation changes may seem small — amounting to fractions of inches per year — but they can increase or decrease local flood risk, wave exposure, and saltwater intrusion.
Tracking and predicting sea level rise involves more than measuring the height of our oceans: Land along coastlines also inches up and down in elevation. Using California as a case study, a NASA-led team has shown how seemingly modest vertical land motion could significantly impact local sea levels in coming decades.
By 2050, sea levels in California are expected to increase between 6 and 14.5 inches (15 and 37 centimeters) higher than year 2000 levels. Melting glaciers and ice sheets, as well as warming ocean water, are primarily driving the rise. As coastal communities develop adaptation strategies, they can also benefit from a better understanding of the land’s role, the team said. The findings are being used in updated guidance for the state.
“In many parts of the world, like the reclaimed ground beneath San Francisco, the land is moving down faster than the sea itself is going up,” said lead author Marin Govorcin, a remote sensing scientist at NASA’s Jet Propulsion Laboratory in Southern California.
The new study illustrates how vertical land motion can be unpredictable in scale and speed; it results from both human-caused factors such as groundwater pumping and wastewater injection, as well as from natural ones like tectonic activity. The researchers showed how direct satellite observations can improve estimates of vertical land motion and relative sea level rise. Current models, which are based on tide gauge measurements, cannot cover every location and all the dynamic land motion at work within a given region.
Local Changes
Researchers from JPL and the National Oceanic and Atmospheric Administration (NOAA) used satellite radar to track more than a thousand miles of California coast rising and sinking in new detail. They pinpointed hot spots — including cities, beaches, and aquifers — at greater exposure to rising seas now and in coming decades.
To capture localized motion inch by inch from space, the team analyzed radar measurements made by ESA’s (the European Space Agency’s) Sentinel-1 satellites, as well as motion velocity data from ground-based receiving stations in the Global Navigation Satellite System. Researchers compared multiple observations of the same locations made between 2015 to 2023 using a processing technique called interferometric synthetic aperture radar (InSAR).
Scientists mapped land sinking (indicated in blue) in coastal California cities and in parts of the Central Valley due to factors like soil compaction, erosion, and groundwater withdrawal. They also tracked uplift hot spots (shown in red), including in Long Beach, a site of oil and gas production.
NASA Earth Observatory
Homing in on the San Francisco Bay Area — specifically, San Rafael, Corte Madera, Foster City, and Bay Farm Island — the team found the land subsiding at a steady rate of more than 0.4 inches (10 millimeters) per year due largely to sediment compaction. Accounting for this subsidence in the lowest-lying parts of these areas, local sea levels could rise more than 17 inches (45 centimeters) by 2050. That’s more than double the regional estimate of 7.4 inches (19 centimeters) based solely on tide gauge projections.
Not all coastal locations in California are sinking. The researchers mapped uplift hot spots of several millimeters per year in the Santa Barbara groundwater basin, which has been steadily replenishing since 2018. They also observed uplift in Long Beach, where fluid extraction and injection occur with oil and gas production.
The scientists further calculated how human-induced drivers of local land motion increase uncertainties in the sea level projections by up to 15 inches (40 centimeters) in parts of Los Angeles and San Diego counties. Reliable projections in these areas are challenging because the unpredictable nature of human activities, such as hydrocarbon production and groundwater extraction, necessitating ongoing monitoring of land motion.
Fluctuating Aquifers, Slow-Moving Landslides
In the middle of California, in the fast-sinking parts of the Central Valley (subsiding as much as 8 inches, or 20 centimeters, per year), land motion is influenced by groundwater withdrawal. Periods of drought and precipitation can alternately draw down or inflate underground aquifers. Such fluctuations were also observed over aquifers in Santa Clara in the San Francisco Bay Area, Santa Ana in Orange County, and Chula Vista in San Diego County.
Along rugged coastal terrain like the Big Sur mountains below San Francisco and Palos Verdes Peninsula in Los Angeles, the team pinpointed local zones of downward motion associated with slow-moving landslides. In Northern California they also found sinking trends at marshlands and lagoons around San Francisco and Monterey bays, and in Sonoma County’s Russian River estuary. Erosion in these areas likely played a key factor.
Scientists, decision-makers, and the public can monitor these and other changes occurring via the JPL-led OPERA (Observational Products for End-Users from Remote Sensing Analysis) project. The OPERA project details land surface elevational changes across North America, shedding light on dynamic processes including subsidence, tectonics, and landslides.
The OPERA project will leverage additional state-of-the-art InSAR data from the upcoming NISAR (NASA-Indian Space Research Organization Synthetic Aperture Radar) mission, expected to launch within the coming months.
This artist’s concept visualizes a super-Neptune world orbiting a low-mass star near the center of our Milky Way galaxy. Scientists recently discovered such a system that may break the current record for fastest exoplanet system, traveling at least 1.2 million miles per hour, or 540 kilometers per second.
NASA/JPL-Caltech/R. Hurt (Caltech-IPAC)
Astronomers may have discovered a scrawny star bolting through the middle of our galaxy with a planet in tow. If confirmed, the pair sets a new record for the fastest-moving exoplanet system, nearly double our solar system’s speed through the Milky Way.
The planetary system is thought to move at least 1.2 million miles per hour, or 540 kilometers per second.
“We think this is a so-called super-Neptune world orbiting a low-mass star at a distance that would lie between the orbits of Venus and Earth if it were in our solar system,” said Sean Terry, a postdoctoral researcher at the University of Maryland, College Park and NASA’s Goddard Space Flight Center in Greenbelt, Maryland. Since the star is so feeble, that’s well outside its habitable zone. “If so, it will be the first planet ever found orbiting a hypervelocity star.”
The pair of objects was first spotted indirectly in 2011 thanks to a chance alignment. A team of scientists combed through archived data from MOA (Microlensing Observations in Astrophysics) – a collaborative project focused on a microlensing survey conducted using the University of Canterbury Mount John Observatory in New Zealand — in search of light signals that betray the presence of exoplanets, or planets outside our solar system.
Microlensing occurs because the presence of mass warps the fabric of space-time. Any time an intervening object appears to drift near a background star, light from the star curves as it travels through the warped space-time around the nearer object. If the alignment is especially close, the warping around the object can act like a natural lens, amplifying the background star’s light.
This artist’s concept visualizes stars near the center of our Milky Way galaxy. Each has a colorful trail indicating its speed –– the longer and redder the trail, the faster the star is moving. NASA scientists recently discovered a candidate for a particularly speedy star, visualized near the center of this image, with an orbiting planet. If confirmed, the pair sets a record for fastest known exoplanet system.
NASA/JPL-Caltech/R. Hurt (Caltech-IPAC)
In this case, microlensing signals revealed a pair of celestial bodies. Scientists determined their relative masses (one is about 2,300 times heavier than the other), but their exact masses depend on how far away they are from Earth. It’s sort of like how the magnification changes if you hold a magnifying glass over a page and move it up and down.
“Determining the mass ratio is easy,” said David Bennett, a senior research scientist at the University of Maryland, College Park and NASA Goddard, who co-authored the new paper and led the original study in 2011. “It’s much more difficult to calculate their actual masses.”
The 2011 discovery team suspected the microlensed objects were either a star about 20 percent as massive as our Sun and a planet roughly 29 times heavier than Earth, or a nearer “rogue” planet about four times Jupiter’s mass with a moon smaller than Earth.
To figure out which explanation is more likely, astronomers searched through data from the Keck Observatory in Hawaii and ESA’s (European Space Agency’s) Gaia satellite. If the pair were a rogue planet and moon, they’d be effectively invisible – dark objects lost in the inky void of space. But scientists might be able to identify the star if the alternative explanation were correct (though the orbiting planet would be much too faint to see).
They found a strong suspect located about 24,000 light-years away, putting it within the Milky Way’s galactic bulge — the central hub where stars are more densely packed. By comparing the star’s location in 2011 and 2021, the team calculated its high speed.
This Hubble Space Telescope image shows a bow shock around a very young star called LL Ori. Named for the crescent-shaped wave made by a ship as it moves through water, a bow shock can be created in space when two streams of gas collide. Scientists think a similar feature may be present around a newfound star that could be traveling at least 1.2 million miles per hour, or 540 kilometers per second. Traveling at such a high velocity in the galactic bulge (the central part of the galaxy) where gas is denser could generate a bow shock.
NASA and The Hubble Heritage Team (STScI/AURA); Acknowledgment: C. R. O’Dell (Vanderbilt University)
But that’s just its 2D motion; if it’s also moving toward or away from us, it must be moving even faster. Its true speed may even be high enough to exceed the galaxy’s escape velocity of just over 1.3 million miles per hour, or about 600 kilometers per second. If so, the planetary system is destined to traverse intergalactic space many millions of years in the future.
“To be certain the newly identified star is part of the system that caused the 2011 signal, we’d like to look again in another year and see if it moves the right amount and in the right direction to confirm it came from the point where we detected the signal,” Bennett said.
“If high-resolution observations show that the star just stays in the same position, then we can tell for sure that it is not part of the system that caused the signal,” said Aparna Bhattacharya, a research scientist at the University of Maryland, College Park and NASA Goddard who co-authored the new paper. “That would mean the rogue planet and exomoon model is favored.”
NASA’s upcoming Nancy Grace Roman Space Telescope will help us find out how common planets are around such speedy stars, and may offer clues to how these systems are accelerated. The mission will conduct a survey of the galactic bulge, pairing a large view of space with crisp resolution.
“In this case we used MOA for its broad field of view and then followed up with Keck and Gaia for their sharper resolution, but thanks to Roman’s powerful view and planned survey strategy, we won’t need to rely on additional telescopes,” Terry said. “Roman will do it all.”
Newly Minted Ph.D. Studies Phytoplankton with NASA’s FjordPhyto Project
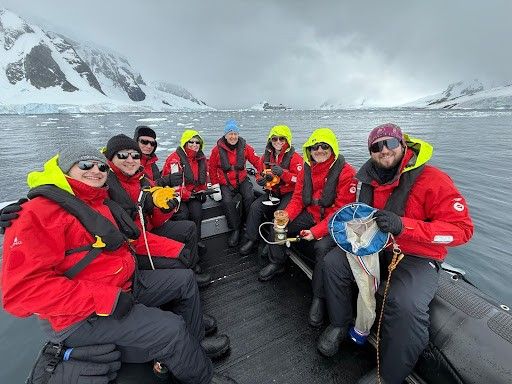
Adventurous travellers aboard the Viking Octantis ship, sampling phytoplankton from Danco Island in the Errera Channel for the FjordPhyto project.
Allison Cusick
FjordPhyto is a collective effort where travelers on tour expedition vessels in Antarctica help scientists at Scripps Institution of Oceanography and Universidad Nacional de La Plata study phytoplankton. Now project leader Dr. Allison Cusick has a Ph.D.! . Dr. Cusick studies how melting glaciers influence phytoplankton in the coastal regions. She wrote her doctoral dissertation based on the data collected by FjordPhyto volunteers.
“Travelers adventure to the wild maritime climate of Antarctica and help collect samples from one of the most data-limited regions of the world,” said Cusick. “While on vacation, they can volunteer to join a FjordPhyto science boat experience where they spend an hour collecting water measurements like salinity, temperature, chlorophyll-a, turbidity, as well as physical samples for molecular genetics work, microscopy identification, and carbon biomass estimates. It’s a full immersion into the ecosystem and the importance of polar research!”
Cusick successfully defended her thesis on December 18, 2024, earning a Ph.D. in Oceanography from the Scripps Institution of Oceanography. Hers is the second Ph.D. based on data from the FjordPhyto project. Martina Mascioni from FjordPhyto team earned her Ph.D. from the National University of La Plata (Argentina) in 2023.
The project is a hit with travelers, too.
“It’s incredibly inspiring to be part of a program like this that’s open to non-specialist involvement,” said one volunteer, a retired biology teacher aboard the Viking Octantis ship, who continued to say, “Thank you for letting us be a part of the science and explaining so clearly why it matters to the bigger picture.”
If you would like to get involved, go to www.fjordphyto.org and reach out to the team!
The internet erupted in controversy over Felisa Wolfe-Simon and colleagues’ claim of a microbe thriving on arsenic. Nearly 15 years later, she’s pursuing new research on the boundaries of life.
The European Space Agency (ESA) said Monday that its Euclid space telescope has detected a rare bright halo of light around a nearby galaxy.
Known as an Einstein ring, the halo was captured in photos encircling a galaxy nearly 590 million light-years away, which is considered close by cosmic standards. A single light-year is measured at 5.8 trillion miles.
While astronomers have known about the galaxy where the phenomenon was captured for over a century, they were surprised when Euclid revealed the bright glowing ring,
Euclid blasted off from Cape Canaveral, Florida on July 1, 2023, to begin a six-year mission to explore the dark universe.
But before the space telescope could begin its survey of the universe, scientists had to ensure everything onboard was working properly. During the early phase of testing, which took place in September 2023, Euclid sent images back to Earth.
The ESA said the images were deliberately out of focus, but in one of the images, Euclid Archive Scientist Bruno Altieri saw what he believed was a very special phenomenon and decided to look at it a bit closer.
"I look at the data from Euclid as it comes in," Bruno said in a press release from the ESA. "Even from that first observation, I could see it, but after Euclid made more observations of the area, we could see a perfect Einstein ring. For me, with a lifelong interest in gravitational lensing, that was amazing."
For most of the population out there, an Einstein Ring is an "extremely rare phenomenon," the ESA said.
When a distant galaxy is observed through a telescope, the light from that galaxy may encounter another galaxy on its way to the telescope. When that happens, the foreground galaxy acts like a magnifying glass, and gravity causes the traveling light rays to bend. When light rays bend, scientists call that gravitational lensing, according to the ESA.
When the background galaxy, lensing galaxy and telescope are in perfect alignment, the image appears as a ring, also known as an Einstein Ring.
The galaxy, called NGC 6506, is about 590 million light-years away, and this is the first time the ring of light around its center has ever been detected.
"All strong lenses are special, because they're so rare, and they're incredibly useful scientifically," Conor O’Riordan of the Max Planck Institute for Astrophysics said. "This one is particularly special, because it’s so close to Earth and the alignment makes it very beautiful."
Einstein rings are based on physicist Albert Einstein’s general theory of relativity, which predicts that light will bend around objects in space, so they focus the light like giant lenses, ESA said. The phenomenon allows scientists to sometimes see the light from distant galaxies that would otherwise be hidden.
"I find it very intriguing that this ring was observed within a well-known galaxy, which was first discovered in 1884," Valeria Pettorino, ESA Euclid project scientist, said. "The galaxy has been known to astronomers for a very long time. And yet this ring was never observed before. This demonstrates how powerful Euclid is, finding new things even in places we thought we knew well. This discovery is very encouraging for the future of the Euclid mission and demonstrates its fantastic capabilities."
Over the course of the mission, scientists expect Euclid will reveal more about the role of gravity in the Universe, as well as the nature of dark energy and dark matter.
Euclid will map over a third of the sky and observe billions of galaxies as far as 10 billion light-years away, ESA said. In doing so, scientists expect Euclid to find around 100,000 more strong lenses, though finding one so cosmically close to home and so spectacular, ESA added, "is astonishing."
"Euclid is going to revolutionize the field, with all this data we've never had before," O’Riordan said.
In its notice outlining the large cut in university funding, the US National Institutes of Health seems to draw on a report from a conservative think tank that denounces the “political left.”